New Legaspi Airport Draft FS - PPP Center
New Legaspi Airport Draft FS - PPP Center
New Legaspi Airport Draft FS - PPP Center

You also want an ePaper? Increase the reach of your titles
YUMPU automatically turns print PDFs into web optimized ePapers that Google loves.
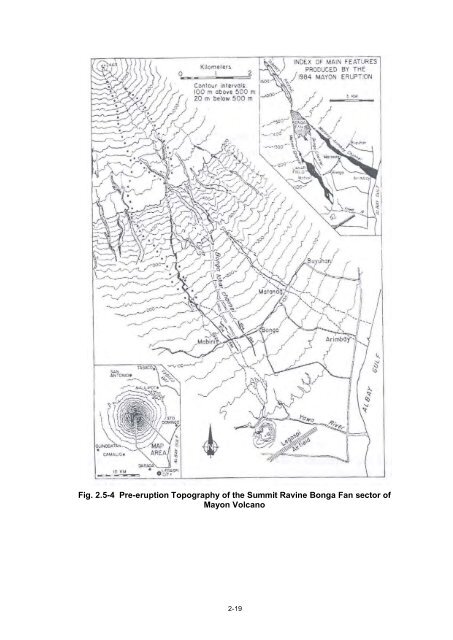
Fig. 2.5-4 Pre-eruption Topography of the Summit Ravine Bonga Fan sector of<br />
Mayon Volcano<br />
2-19
2.5.3 Noise<br />
Ashfalls during eruptions of the volcano are generally experienced in the<br />
municipalities of Camalig, Guinobatan and Ligao in the southwest, and in Tabaco<br />
in the northeast (Figure 2.5-5). This phenomenon is caused by the predominant<br />
wind drift around the volcano in the NE direction during the months of October to<br />
June, and in the SW direction during the months of July to September. However,<br />
<strong>Legaspi</strong> City experienced considerable ashfalls during past eruptions, particularly<br />
in the 1897, 1984 and 1993 eruptions.<br />
In the absence of a definitive noise standards for aircraft operations in the<br />
Philippines, USFAA Regulation (FAR 150), identifies compatible land uses based<br />
on day-night sound levels. It specifies a yearly day-night average sound level of<br />
less than 65 dB for residential, schools and hospitals. For comparison, a jet<br />
aircraft taking-off nearby registers at least 140 dB, which is more than the human<br />
threshold of 120 dB for pain but lower than 150 dB which is known to rupture the<br />
human eardrum.<br />
The noise pollution that will be generated by the landing and take-off of aircraft will<br />
be a critical issue in the future since the areas within the immediate vicinity of the<br />
airport is experiencing steady growth in population and commercial activities.<br />
Over a period of eight years (1990-1998), an average of 37 hectares of agricultural<br />
land per year were converted to urban use. Barangay Bagtang with many<br />
residential structures and where Rwy 06 is located will be most affected by aircraft<br />
noise.<br />
2-20
Fig. 2.5-5 Mayon Volcano Ashfall Hazard Map (January 2000)<br />
2-21
Chapter 3 AIR TRAFFIC DEMAND FORECAST<br />
3.1 INTRODUCTION<br />
3.1.1 Previous Studies<br />
The most recent attempt to forecast the magnitude of aviation activities in<br />
<strong>Legaspi</strong> <strong>Airport</strong> was the study done by ECFA in 1997. The result of the<br />
forecasting exercise done is summarized in Table 3.1-1, indicating an<br />
estimated passenger volume of more than 270,000 and a cargo volume of<br />
1,500 tons for year 2000.<br />
Table 3.1-1 Previous Forecast of Air Traffic Demand<br />
Year<br />
PHI<br />
Passenger Cargo (tons)<br />
LEG<br />
Passenger Cargo (tons)<br />
2000 18,496,000 258,100 276,000 1,500<br />
2005 25,192,000 329,400 375,000 1,900<br />
2010 30,885,000 400,800 460,000 2,300<br />
2015 36,073,000 472,200 537,000 2,700<br />
Source: ECFA Study 1997<br />
Historical records, however, have shown that the passenger movement at the<br />
existing <strong>Legaspi</strong> <strong>Airport</strong> has decreased to 100,000 in the year 2000 from<br />
174,000 in 1997. The performance in air cargo has shown a similar trend<br />
(Table 3.1-2). Both passenger and cargo forecasts have not shown the rates<br />
of increase anticipated in the earlier study. This highlights the need to update<br />
the forecast, taking into consideration the recent trends and developments.<br />
Philippine Airlines is currently providing one daily, plus three additional return<br />
flights, per week between Manila and <strong>Legaspi</strong>, using B737 aircraft at one-way air<br />
fare of PhP2,418. Meanwhile, two daily services costing PhP 300 to 380 are<br />
provided by the Philippine National Railways and more frequent bus services are<br />
available at a one-way cost of approximately PhP 400. Competition with land<br />
transportation partly explains the observed trends in traffic.<br />
Table 3.1-2 Actual Passenger Volumes<br />
Year<br />
Passenger<br />
PHI<br />
Cargo (tons)<br />
LEG<br />
Passenger Cargo (tons)<br />
1990 8,197,482 347,117 (1991) 142,179 470 (1991)<br />
1995 10,853,335 488,366 154,623 939<br />
2000<br />
Source: ATO<br />
12,921,728 553,159 100,098 428<br />
3-1
ORIGINS<br />
In 2001, DOTC commissioned a nationwide survey, which resulted in, among<br />
others, an estimate of dominant trip directions using air transportation. The<br />
Origin–Destination Survey conducted during that year highlighted the<br />
predominant travel directions in the Bicol Region, confirming the importance<br />
of Albay (site of <strong>Legaspi</strong> <strong>Airport</strong>) as the main origin and destination within the<br />
Region. In terms of trip desires, Albay is followed by Camarines Sur, where<br />
Naga <strong>Airport</strong> is situated. Table 3.1-3 indicates that, apart from Manila and<br />
possibly Cebu, there is no other significant origin and destination associated<br />
with <strong>Legaspi</strong> <strong>Airport</strong>.<br />
Table 3.1-3 Trip Origin-Destination (Percentage)<br />
DESTINATIONS<br />
O/D<br />
1 2 3 4 5 6 7 8 9<br />
TOTAL<br />
ORIGINS<br />
1. Manila 7.58 0.33 0.38 0.07 0.15 0.05 28.42 36.98<br />
2. Cebu 12.33 0.10 0.02 6.61 19.06<br />
3. C.Norte 0.02 0.02<br />
4. C.Sur 0.08 0.05 0.13<br />
5. Albay 0.92 0.20 1.12<br />
6. Sorsogon 0.17 0.02 0.02 0.20<br />
7. Masbate 0.02 0.02<br />
8.Catanduanes 0.02 0.02<br />
9. Total Other Provinces 25.67 4.34 0.10 0.25 0.02 0.03 12.05 42.46<br />
TOTAL DESTINATIONS 39.19 11.93 0.00 0.53 0.65 0.07 0.17 0.08 47.38 100.00<br />
3.1.2 Forecast Methodologies<br />
The performance of various forecasting methodologies applied in the past is<br />
summarized in Table 3.1-4. Among the various projections, the NAASP<br />
Forecast using Econometric Modeling appears to have closely predicted the<br />
actual traffic, although a systematic underestimation is clearly evident. It<br />
seems that both complex econometric models and simple trend projections<br />
used in the past have resulted in about the same level of prediction<br />
performance.<br />
Table 3.1-4 Comparison of Forecast Methodologies<br />
YEAR CAMP (1992) NTPP (1980)<br />
JAC<br />
(MACTAN<br />
MODEL)<br />
ECFA (1997) NAASP (1979) ACTUAL<br />
1980 70,498 69,791<br />
1986 82,650 131,788<br />
3-2
Method<br />
YEAR CAMP (1992) NTPP (1980)<br />
JAC<br />
(MACTAN<br />
MODEL)<br />
3-3<br />
ECFA (1997) NAASP (1979) ACTUAL<br />
1990 175,343 163,545 136,132 94,832 142,179<br />
1995 246,601 221,550 253,447 154,623<br />
2000 317,827 279,556 472,081 276,000 100,098<br />
Mean Absolute<br />
Deviation<br />
Mean Square<br />
Error<br />
Mean Absolute<br />
Percentage<br />
Error<br />
Time-Series<br />
Decomposition<br />
Trend<br />
Projection<br />
Econometric<br />
Model (GRDP,<br />
Population)<br />
Econometric<br />
Model<br />
Econometric<br />
Model<br />
114,290 89,250 154,920 175,902 33,030<br />
18,988,573,607 12,380,301,016 49,391,367,158 30,941,513,604 1,660,459,058<br />
100.11% 79.20% 146.59% 175.73% 24.37%<br />
The forecasting methodology adopted in the current exercise recognizes the<br />
past trend as well as the overall role of <strong>Legaspi</strong> in the regional and national<br />
network of airports. It involves a three-step process requiring first a prediction<br />
of the national and regional passenger volume as input to a paired passenger<br />
movement estimate to and from <strong>Legaspi</strong>. The share of potential <strong>Legaspi</strong><br />
<strong>Airport</strong> passenger traffic is then estimated as a fraction of the total national or<br />
regional estimate of passenger traffic volume, estimated using econometric<br />
models. Finally, the peak-hour passenger and aircraft movement is estimated<br />
by analyzing the daily traffic record over the last two years.<br />
The various graphs of <strong>Legaspi</strong>’s passenger share shown in Chapter 2 indicate<br />
that the long-term variation can be assumed to represent a stationary time<br />
series focused around a particular value. A stationary time series is<br />
characterized by observations that can be represented by a constant plus a<br />
random fluctuation. In essence, each time series datum of traffic volume at<br />
any time, designated as Vt , can be represented by two components, to wit:<br />
Vt = μ + εt<br />
Where μ = unknown constant corresponding to the mean of the series, and<br />
εt = random error<br />
Instead of utilizing an estimated passenger share based on an average over<br />
the past, an exponential smoothing equation is used to adjust a previous<br />
forecast by a fraction of the previous forecast error to obtain the current<br />
forecast. The exponential smoothing equation is given by<br />
Ft = Ft-1 – αεt-1,
Where, Ft = forecast in period t<br />
Ft-1 =forecast in period t-1<br />
α = smoothing constant<br />
εt-1 = observed forecast error at time t-1<br />
The passenger volume for the entire domestic and NCR (the most significant<br />
airport pair for <strong>Legaspi</strong>, refer to Inception Report Feb 2002) are estimated<br />
using econometric models. A summary of the model-building exercise is<br />
provided in the Annex.<br />
3.2 ANNUAL PASSENGER TRAFFIC FORECAST<br />
3.2.1 Forecast Air Passenger Volume at <strong>Legaspi</strong> <strong>Airport</strong><br />
The estimated total domestic passenger traffic volumes for NCR and the<br />
entire Country are shown in Table 3.2-1. Based on an extensive review of<br />
past modeling exercises, it seems that the most significant variable to explain<br />
the variation in air passenger traffic has been the population of the airport<br />
hinterland. The current modeling exercise looked into a wide range of<br />
variables and finally opted to limit consideration to population as the<br />
explanatory variable, due to problems on statistical data multicollinearity and<br />
the issue of model parsimony. Using a 20-year time series data beginning in<br />
1980, the resulting models in shifted forms are:<br />
For MNL : PAX = 1.23(POPNCR – 5,053,341.41), Multiple R = 0.96<br />
For PHI : PAX = 0.34(POPPHI-36,118,392.47), Multiple R = 0.97.<br />
Table 3.2-1 Forecast Of Domestic Air Passenger Volumes (NCR and Philippines)<br />
YEAR DOMESTIC NCR TOTAL DOMESTIC<br />
2000 5,959,595 13,346,697<br />
2005 6,996,760 15,519,780<br />
2010 7,912,460 17,436,360<br />
2015 8,738,510 19,219,060<br />
2020 9,492,980 21,011,610<br />
2025 10,108,390 22,719,660<br />
For <strong>Legaspi</strong> <strong>Airport</strong>, the forecast of low, medium and high air passenger<br />
volume estimates are shown in Table 3.2-2. Under the medium forecast, it is<br />
estimated that <strong>Legaspi</strong> may be serving a potential volume of 217,080<br />
passenger movements in 2015.<br />
3-4
Table 3.2-2 Forecast of Domestic Air Passenger Volumes at <strong>Legaspi</strong><br />
YEAR LOW MEDIUM HIGH<br />
2005 146,930 175,300 183,360<br />
2010 166,160 196,950 206,010<br />
2015 183,510 217,080 227,070<br />
2020 199,350 237,330 248,250<br />
2025 212,280 256,620 268,430<br />
3.2.2 Allocated Sector Passenger Forecast<br />
As shown in the preceding section, the most significant origins and<br />
destinations associated with <strong>Legaspi</strong> <strong>Airport</strong> are Manila and Cebu. Using a<br />
gravity model with population and sector distance as the parameters, the total<br />
estimated passenger movements in <strong>Legaspi</strong> were allocated to the <strong>Legaspi</strong>-<br />
Manila and <strong>Legaspi</strong>-Cebu routes. The mathematical form of the allocation<br />
model is expressed as:<br />
Where :<br />
Vij = LGP [(Pi/ ΣPm ) x (Pj/ ΣPm)] ,<br />
λ V m =i,j<br />
Table 3.2-3 Route-Allocated Annual Air Passenger Traffic Forecast<br />
3-5<br />
Dij θ<br />
Vij = Air passenger volume between <strong>Airport</strong> i and <strong>Airport</strong> j<br />
V LGP =Estimated total air passenger volume at <strong>Legaspi</strong> for each analysis year<br />
Pi,j = Population at hinterland I and j<br />
Dij = Sector distance between I and j<br />
λ,θ = Estimated parameters<br />
The calibrated model results in the route-allocation are summarized in Table<br />
3.2-3.<br />
Year<br />
NCR<br />
Population<br />
Cebu Albay<br />
Sector Air Traffic Volume<br />
MLA-LGP CEB-LGP<br />
2005 10,737,419 3,251,166 1,287,725 155,444 18,863<br />
2010 11,481,317 3,431,904 1,364,343 173,382 21,226<br />
2015 12,152,388 3,599,851 1,436,547 190,322 23,435<br />
2020 12,765,312 3,772,311 1,514,066 208,623 25,684<br />
2025 13,256,262 3,936,338 1,592,712 227,761 27,867
3.3 ANNUAL AIR CARGO FORECAST<br />
Using the same approach employed in defining the passenger forecast as outlined in<br />
the preceding section, the forecast cargo traffic at the <strong>Legaspi</strong> <strong>Airport</strong> was derived as a<br />
percentage share of the nationwide airport system cargo traffic. Historical data (Table<br />
3.3-1) were similarly utilized to define an econometric model with value of domestic<br />
production as the explanatory variable.<br />
Table 3.3-1 Historical Cargo Traffic (tons)<br />
YEAR PHI NCR Region V LEG<br />
1991 347,117 93,036 1,549 470<br />
1992 381,139 82,520 1,473 444<br />
1993 415,639 92,412 1,825 775<br />
1994 428,204 68,512 2,351 936<br />
1995 488,366 89,791 2,230 939<br />
1996 526,277 108,685 2,898 1,013<br />
1997 678,765 115,356 3,089 862<br />
1998 504,096 97,322 2,419 758<br />
1999 510,630 87,107 2,195 771<br />
2000 553,159 125,872 1,501 428<br />
Under the medium-level estimate, <strong>Legaspi</strong> <strong>Airport</strong> is anticipated to handle about 2,000<br />
tons of cargo in year 2015 (Table 3.3-2).<br />
Table 3.3-2 Forecast Cargo Traffic (tons)<br />
Year PHI<br />
Low<br />
LEGASPI<br />
Medium High<br />
2005 840,390 870 1,030 1,210<br />
2010 1,182,300 1,230 1,440 1,700<br />
2015 1,609,190 1,670 1,970 2,310<br />
2020 2,163,150 2,250 2,640 3,110<br />
2025 2,882,020 2,990 3,520 4,150<br />
3.4 PEAK-HOUR AIR TRAFFIC VOLUMES<br />
The design of airport facilities is normally based on the volume occurring during the<br />
peak-hour on an average day of the peak month. Adjustment factors are derived to<br />
translate the forecasted two-way annual air traffic into the design hourly volume.<br />
Using data provided by ATO-<strong>Legaspi</strong> for the last two years (2000-2001), the peak<br />
month was determined to be consistently occurring during the month of May. The<br />
3-6
average day traffic of the peak month was computed to be 0.375 percent of the annual<br />
air passenger volume.<br />
Considering the prevailing flight patterns in <strong>Legaspi</strong> <strong>Airport</strong>, the peak hour traffic on an<br />
average day of the peak month is about 57.5 percent of the total daily traffic.<br />
The design of airport facilities is based on one-way directional traffic volume<br />
considering the direction with the higher percentage of passenger movement. The<br />
heavier direction constitutes about 51 percent of the total hourly traffic.<br />
Finally, the design hourly volume is determined by adjusting the one-way peak-hour<br />
traffic using a load factor to account for the utilization of available seats. For <strong>Legaspi</strong><br />
<strong>Airport</strong>, a load factor of 85 percent is assumed for better utilization of available seating<br />
capacity. The computed design hourly volume is shown in Table 3.4-1.<br />
Year<br />
Table 3.4-1 Peak-Hour Air Passenger Traffic Forecat<br />
Two-way Air<br />
Passenger<br />
Traffic<br />
Peak-Month<br />
Average Daily<br />
Traffic<br />
3-7<br />
Peak-Hour<br />
Traffic<br />
One-way<br />
Directional<br />
Traffic<br />
Design Hourly<br />
Volume<br />
ADF=0.00375 PHF=0.575 DF=0.510 Load Factor = 0.85<br />
2005 175,297 657 378 193 227<br />
2010 196,945 739 425 217 255<br />
2015 217,081 814 468 239 281<br />
2020 237,328 890 512 261 307<br />
2025 256,620 962 553 282 332<br />
3.5 FORECAST OF AIR TRAFFIC MOVEMENT<br />
The aircraft fleet of Philippine Airlines (PAL) over the last three (3) years is<br />
summarized in Table 3.5-1. During the period, increments were noted in the number<br />
of B737-300, B737-400, A340-300 and B747-200.<br />
Table 3.5-1 Aircraft Fleet of PAL<br />
Aircraft Model Sept 1999 Aug 2000 Feb 2001<br />
B747-400 4 4 4<br />
B747-200 0 3 3<br />
A340-300 2 4 4<br />
A330-300 8 8 8<br />
A320-200 3 3 3<br />
B737-400 0 0 3<br />
B737-300 7 9 9<br />
TOTAL 24 31 34
In domestic operations, A330, A320 and B737 will continue to serve as PAL’s main<br />
fleet. In <strong>Legaspi</strong> <strong>Airport</strong>, the short- to medium-term passenger demand will be in the<br />
range to be served by medium-sized jet aircraft such as A320-200 and B737. This is<br />
reflected in PAL’s development requirements over the short-term. Table 3.5-2<br />
summarizes the indicative timetable of PAL’s <strong>Airport</strong> Development requirements over<br />
the short- term period.<br />
Design<br />
Aircraft<br />
A330<br />
A320<br />
B737<br />
Table 3.5-2 PAL <strong>Airport</strong> Development Requirements<br />
Immediate 1999<br />
Schedule<br />
2000 2002 2004<br />
Davao<br />
Bacolod(<strong>New</strong>) C.de Oro<br />
Pto.Princesa<br />
Gen.Santos<br />
Iloilo(<strong>New</strong>) Zamboanga<br />
Bacolod(exist) Cotabato Butuan<br />
Davao<br />
Dumaguete Dipolog<br />
Kalibo<br />
<strong>Legaspi</strong><br />
Naga<br />
Tagbilaran<br />
Roxas<br />
Until 1996, PAL operated along routes connecting <strong>Legaspi</strong> to Masbate, Virac, Cebu<br />
and Manila. Thereafter all routes, except those connecting <strong>Legaspi</strong> with Manila and<br />
Cebu were discontinued for reasons of declining route profitability. In 1998, PAL<br />
eventually discontinued the <strong>Legaspi</strong>-Cebu leg for similar reasons.<br />
<strong>New</strong> airlines, however, have started to serve many routes abandoned by PAL. Asian<br />
Spirit has been serving similar routes abandoned by PAL using smaller aircraft. This<br />
report anticipates that the route connecting Cebu with <strong>Legaspi</strong> will represent less than<br />
12 percent of the total potential volume of the air passenger traffic in <strong>Legaspi</strong> (Table<br />
3.5-3). It is assumed that this will be served by other airlines.<br />
Table 3.5-3 Air Passenger Volume Per Route<br />
Peak-hour Air Passenger Volume Per Route<br />
(One way)<br />
3-8<br />
Annual Air Passenger Volume<br />
Per Route<br />
(Two-way)<br />
Year<br />
Total MLA-LEG CEB-LEG MLA-LEG CEB-LEG<br />
2005 227 203 24 155,444 18,863<br />
2010 255 227 28 173,382 21,226<br />
2015 281 250 31 190,322 23,435<br />
2020 307 273 34 208,623 25,684<br />
2025 332 296 36 227,761 27,867
The aircraft movement is estimated assuming that passenger traffic volumes between<br />
30,000 to 300,000 will be served by small jets in the mold of B737 or A320. Lower<br />
volumes will be served by turbo prop aircraft with a seating capacity of about 50-54<br />
passengers. A summary of the forecast annual aircraft movements is given in Table<br />
3.5-4.<br />
Table 3.5-4 Forecast Aircraft Movement<br />
Year Aircraft Type Seat Capacity<br />
Route Allocated Passenger<br />
Movement Cargo (tons)<br />
MLA-LEG CEB-LEG<br />
Passenger Volume 155,444 18,863<br />
2005<br />
SJ<br />
TP<br />
130<br />
54<br />
1,407<br />
412<br />
1,030<br />
Total 1,819<br />
Passenger Volume 173,382 21,226<br />
2010<br />
SJ<br />
TP<br />
130<br />
54<br />
1,569<br />
463<br />
1,440<br />
Total 2,032<br />
Passenger Volume 190,322 23,435<br />
2015<br />
SJ<br />
TP<br />
130<br />
54<br />
1,723<br />
511<br />
1,970<br />
Total 2,234<br />
Passenger Volume 208,623 25,684<br />
2020<br />
SJ<br />
TP<br />
130<br />
54<br />
1,888<br />
560<br />
2,640<br />
Total 2,448<br />
Passenger Volume 227,761 27,867<br />
2025<br />
SJ<br />
TP<br />
130<br />
54<br />
2,061<br />
607<br />
3,520<br />
Total 2,668<br />
3-9
Chapter 4 AIRPORT FACILITY REQUIREMENT<br />
4.1 SUMMARY<br />
In accordance with the relevant provisions of ICAO guidelines and using planning<br />
parameters derived from previous projects of the Consultant, the requirements for<br />
various facilities were established to optimally address the medium and long-term<br />
requirements of <strong>Legaspi</strong> <strong>Airport</strong>. Any major improvement for the <strong>Legaspi</strong> <strong>Airport</strong> will<br />
entail a substantial amount of time for project preparation and implementation. The<br />
design year for medium-term development is, therefore, assumed to be at year 2015,<br />
allowing at least six (6) years after project completion. Design for long-term<br />
development is based on projected requirements for year 2025. A summary of the<br />
planning criteria and parameters for the horizontal components of the airport is given in<br />
Table 4.1-1. The corresponding requirements for vertical components are<br />
summarized in Table 4.1-2.<br />
Table 4.1-1 Planning Criteria and Parameters (Horizontal Components)<br />
Components<br />
Present Condition<br />
Year 2000<br />
Future Requirements<br />
Year 2015 Year 2025<br />
1. Annual Passengers (‘1000) 100 217 257<br />
2. Annual Cargo (tons) 400 1,970 3,520<br />
3. Annual Commercial Aircraft<br />
Movements<br />
404 (2001) 2,234 2,668<br />
4. Peak-Hour Passengers<br />
(2 ways)<br />
285 562 664<br />
5. Peak Hour Aircraft<br />
Movements (2 ways)<br />
1 2 3<br />
6. Largest Aircraft B737 A320 A320<br />
7. Longest Haul MNL-LEG ditto ditto<br />
8. Aerodrome Reference<br />
Code<br />
4C 4C 4C(4E)<br />
9. Operational Category Non-Instrument Precision Cat. I Precision Cat. I<br />
10. Runway<br />
− Length<br />
2280 m<br />
2000 m 2000 m (2,500m)<br />
− Width<br />
11. Runway Strip<br />
36 m<br />
45 m<br />
45 m<br />
− Length<br />
2380 m<br />
2120 m<br />
2120 m<br />
− Width<br />
12. Taxiway<br />
150 m<br />
300 m<br />
300 m<br />
− System<br />
2 stub taxiways 1 stub taxiway 1 stub taxiway<br />
− Width<br />
23 m<br />
23m<br />
13. Aircraft Parking Stand 3 2(3) 3<br />
4-1
Table 4.1-2 Planning Criteria and Parameters (Vertical Components)<br />
Components<br />
1. Passenger Terminal<br />
Building<br />
4-2<br />
Future Requirements<br />
Year 2015 Year 2025<br />
5,620 sq.m. 6,640 sq.m.<br />
2. Cargo Terminal Building 200 sq.m. 400 sq.m.<br />
3. Administration Building 1,800 sq.m. 1,800 sq.m.<br />
4. Fire Station Building 270 sq.m. 270 sq.m.<br />
5. Access Road Two-way, Two Lane Two-way, Two Lane<br />
6. Car Park 6,000 sq.m. 7,000 sq.m.<br />
7. Air Navigation Systems Cat I ILS Cat I ILS<br />
8. Rescue and Fire Fighting<br />
− Category<br />
− Fire Vehicles<br />
9. Public Utilities<br />
− Power Supply<br />
− Water Supply<br />
− Sewage Disposal<br />
− Solid Waste Disposal<br />
− Telephone Trunk line<br />
6<br />
min 2<br />
1200 KVA<br />
150 cu.m./day<br />
150 cu.m./day<br />
75 extensions, 25 trunkline<br />
6<br />
min 2<br />
1200 KVA<br />
150 cu.m./day<br />
150 cu.m./day<br />
75 extensions, 25 trunkline<br />
10. Fuel Supply 25 Kl Storage Capacity 50 Kl Storage Capacity<br />
4.2 PLANNING PARAMETERS<br />
4.2.1 General<br />
The physical characteristics of airports to satisfy internationally accepted<br />
standards for operational efficiency and safety are prescribed under ICAO<br />
Annex 14, among other references. ICAO Annex 14 specifies the minimum<br />
configuration and physical characteristics of runway, taxiway and apron in<br />
accordance with an aerodrome reference code and approach category of the<br />
airport runway.<br />
A set of interrelated planning criteria needs to be considered in determining<br />
the required parameters for the airport physical plan. These criteria consist<br />
of:<br />
a) design aircraft<br />
b) aerodrome reference code<br />
c) runway dimensions<br />
d) approach category of runway
The aerodrome reference code is a function of the design aircraft that the<br />
runway is intended to serve. Approach category of the runway is determined<br />
on the basis of anticipated weather conditions (occurrences of low visibility<br />
conditions) and intended service grade (acceptable level of flight cancellations<br />
and delay) for an airport.<br />
4.2.2 Design Aircraft<br />
In domestic operations, A330, A320 and B737 will continue to serve as PAL’s<br />
main fleet. At <strong>Legaspi</strong> <strong>Airport</strong>, the short to medium-term passenger demand<br />
will be in the range to be served by medium-sized jet aircraft such as A320-<br />
200 and B737.<br />
A320, which is slightly bigger than B737 should be chosen as the design<br />
aircraft for the short- to medium-term development period. However, to<br />
provide for unconstrained long-term development, a larger aircraft in the mold<br />
of A330 should be considered for airside separation distance requirements.<br />
Table 4.2-1 provides a comparison among these three (3) aircraft models.<br />
Table 4.2-1 Technical Comparisons among Design Aircraft for <strong>Legaspi</strong><br />
<strong>Airport</strong><br />
Criteria<br />
A320-200<br />
Aircraft Model<br />
B737-400 A330-300<br />
Max Take-off Weight 67 t 63 t 212 t<br />
Seating Capacity 160-170 150-160 300<br />
Overall Length 37.6 m 36.4 m 63.7 m<br />
Wing Span 34.1 m 28.9 m 60.3 m<br />
Tail Height 11.9 m 11.2 m 17.62 m<br />
Wheel Base 12.64 m 14.3 m 22.1 m<br />
Wheel Track 7.6 m 5.2 m 10.7 m<br />
4.2.3 Aerodrome Reference Code<br />
Table 4.2-2 outlines the provisions of aerodrome reference code of ICAO<br />
Annex 14. A320-200 aircraft is categorized as reference code 4C under ICAO<br />
Annex 14. The short- to medium-term development plans for the <strong>Legaspi</strong><br />
<strong>Airport</strong> should satisfy the minimum requirements for this reference code. For<br />
long-term requirements, particularly to provide for operation of larger aircraft<br />
such as A330 and B747, airside separation distance requirements of<br />
reference code 4E should be taken into account.<br />
4-3
A basic runway length of 2,000-m and width of 45-m to cater to the operations<br />
of A320 class aircraft should be provided. The possibility of future expansion<br />
to 2,500-m may also be examined.<br />
Table 4.2-2 Aerodrome Reference Code of ICAO Annex 14<br />
Code<br />
Number<br />
CODE ELEMENT 1<br />
Aeroplane Reference<br />
Field Length<br />
Code<br />
Letter<br />
1 Less than 800 m A<br />
2<br />
3<br />
800m up to but not<br />
including 1,200m<br />
1,200m up to but not<br />
including 1,800m<br />
4 1,800m and over D<br />
B<br />
C<br />
E<br />
F<br />
4-4<br />
CODE ELEMENT 2<br />
Wingspan<br />
Outer Main Gear<br />
Wheel Span<br />
Up to but not Up to but not<br />
including 15m including 4.5m<br />
15m up to but<br />
not including<br />
24m<br />
4.5m up to but not<br />
including 6m<br />
24m up to but<br />
not including<br />
36m<br />
6m up to but not<br />
including 9m<br />
36m up to but<br />
not including<br />
52m<br />
9m up to but not<br />
including 14m<br />
52m up to but<br />
not including<br />
65m<br />
9m up to but not<br />
including 14m<br />
65m up to but<br />
not including<br />
80m<br />
14m up to but not<br />
including 16m<br />
AERODROME REFERENCE CODE FOR LEGASPI AIRPORT<br />
FOR SHORT-TERM DEVELOPMENT : CODE 4C<br />
FOR LONG-TERM DEVELOPMENT : CODE 4E<br />
4.2.4 Approach Category of Runway<br />
Runways are categorized into instrument and non-instrument runways, with<br />
the latter intended for aircraft operation using visual approach procedures.<br />
Instrument runways are further categorized into:<br />
a) Non-precision Approach Runway<br />
b) Precisions Approach Runway (Categories I to III)<br />
<strong>Legaspi</strong> <strong>Airport</strong> is categorized under the Civil Aviation Master Plan as a<br />
trunkline airport. Within Region V, it functions as the main airport access,<br />
accounting for about 50 % of the total regional passenger volume. In view of<br />
this, the airport should be capable of providing efficient, reliable service and<br />
for such purpose, one end of the runway should be precision approach<br />
equipped with Instrument Landing System (ILS), while the other end may be<br />
non-precision instrument approach with directional guidance provided by
VOR/DME. The main and precision approach runway is determined on the<br />
basis of prevailing wind direction and occurrences of low visibility conditions.<br />
The wind rose analysis for <strong>Legaspi</strong> City made by PAGASA based on the data<br />
summarized in Table 4.2-3 indicates the following:<br />
Annual prevailing wind direction is northeasterly, consisting of the North-East<br />
(NE, 36.9%) followed by the East-North-East (ENE, 15.6%) and the East<br />
(E,15.0%);<br />
Southwest to westerly wind directions account for approximately 25% of the<br />
annual occurrences of wind directions; and<br />
Existing runway orientation of 06/24 is confirmed to be optimal in terms of the<br />
usability factor determined by wind speeds and direction.<br />
The wind speeds shown are daily averages observed from 5:00 AM to 6:00<br />
PM and every three hours for a period of 10 years. Thus, the occurrence of<br />
wind speeds exceeding 8 m/s (approximately 15 knots) may be more frequent<br />
than 0.4%. As such, it should not be construed that 99% of the usability factor<br />
(wind coverage in case of cross-wind component limitation of 15 knots) would<br />
be achievable regardless of the runway orientation.<br />
Table 4.2-3 Wind Direction and Speed Distribution (<strong>Legaspi</strong> City, 1987-1996)<br />
Speed<br />
DIRECTION<br />
(m/s) NNE NE ENE E SSW SW WSW W Others Total<br />
Calm 0.0<br />
1-4 1.2 31.6 14.7 14.8 0.3 8.5 7.8 6.2 4.2 89.1<br />
5-8 1.3 5.2 0.9 0.2 0.0 1.1 1.1 0.4 0.3 10.5<br />
>8 0.1 0.1 0.0 0.0 0.0 0.1 0.1 0.1 0.0 0.4<br />
Total 2.6 36.9 15.6 15.0 0.3 9.7 9.0 6.7 4.5 100.0<br />
Source: PAGASA<br />
In the absence of recorded data regarding the cloud base and visibility,<br />
monthly rainy days are correlated with the frequency of wind direction. During<br />
the wettest season from October to January (shown in Table 4.2-4), the<br />
prevailing wind direction is northerly to easterly. It is expected that under low<br />
visibility condition the approaches of landing aircraft would be from the<br />
southwest (existing Rwy 06). In view thereof, precision approach should be<br />
established from the southwest.<br />
4-5
Table 4.2-4 Monthly Weather Data (Rainy Days and Frequency of Wind<br />
Month<br />
Number of<br />
Rainy Days<br />
4-6<br />
Directions)<br />
Rainfall (mm)<br />
Frequency of<br />
Northerly to<br />
Easterly Winds<br />
(%)<br />
Frequency of<br />
Southerly to<br />
Westerly Wind<br />
(%)<br />
January 21 321.9 99.3 0.3<br />
February 15 209.7 99.7 0.3<br />
March 16 185.0 98.8 0.3<br />
April 15 161.0 95.9 2.3<br />
May 14 170.5 74.1 21.0<br />
June 17 259.5 54.0 43.1<br />
July 19 179.0 29.4 65.4<br />
August 18 236.1 20.2 73.1<br />
September 19 261.6 27.6 67.9<br />
October 22 353.8 61.5 33.4<br />
November 22 486.3 89.8 6.0<br />
December 24 562.5 96.6 2.2<br />
Annual 222 3,487.0 70.5 26.6<br />
4.3 RUNWAY STRIP AND OBSTACLE LIMITATION SURFACES<br />
4.3.1 Runway Strip<br />
Following ICAO standards, the dimensions of a runway strip for a precision<br />
approach runway code number 4 shall, wherever practicable, be made to<br />
extend laterally at least to 150 meters on each side of the centerline of the<br />
runway. It should extend before the threshold and beyond the end of the<br />
runway by at least 60 m. Any object situated on the runway strip, which may<br />
endanger aircraft, should be regarded as an obstacle and should, as far as<br />
practicable, be removed. Except for visual aids required for air navigation<br />
purposes, no fixed object shall be permitted on a runway strip within 60 m of<br />
the runway centerline.<br />
4.3.2 Runway End Safety Area<br />
A runway end safety area should be provided at each end of the runway strip.<br />
The runway end safety area should extend from the end of runway strip by at<br />
least 90 m. The width of the runway end safety area should be at least twice<br />
that of the associated runway (i.e., 90 m for the case of <strong>Legaspi</strong>). An object<br />
situated within a runway end safety area, which may endanger aircraft, should<br />
be regarded as an obstacle and should, as far as practicable, be removed.
4.3.3 Obstacle Limitation Surfaces<br />
The following obstacle limitation surfaces shall be established, in accordance<br />
with ICAO standards, for a precision approach runway category I:<br />
a) Conical surface;<br />
b) Inner horizontal surface;<br />
c) Approach surface;<br />
d) Transitional surfaces; and<br />
e) Take-off climb surface<br />
The following obstacle limitation surfaces are also recommended to be<br />
established by ICAO for a precision approach runway category I:<br />
a) Inner approach surface;<br />
b) Inner transitional surfaces;<br />
c) Balked landing surface:<br />
It is recommended that existing objects above these surface should, as far as<br />
practicable, be removed except when an object is shielded by an existing<br />
immovable object, or the object would not adversely affect the safety or<br />
regularity of aircraft operation. The dimensions of obstacle limitation surfaces<br />
are shown in Figure 4-3-1.<br />
4-7
2000 m.<br />
Conical Surface (S=5%)<br />
Approach Surface<br />
Inner Horizontal Surface (H=45m)<br />
4800 m.<br />
1200 m.<br />
R4000 m.<br />
Approach Surface<br />
Take-off Climb Surface Take-off Climb Surface (S=2.0%)<br />
(S=2.0%)<br />
(S=2.5%)<br />
300 m.<br />
315 180 m. m.<br />
(S=0.0%)<br />
Transitional Surface (S=14.3%)<br />
4-8<br />
10920 m. 4080 m. 4080 m.<br />
10920 m.<br />
Horizontal Section<br />
8400 m.<br />
Second Section First Section<br />
3600 m. (S=2.5 %) 3000 m. (S=2.0 %) Runway StripFirst Section Second Section<br />
3000 m. (S=2.0 %) 3600 m. (S=2.5 %)<br />
Horizontal Section<br />
8400 m.<br />
Runway<br />
1950 m.<br />
Inner Transitional Surface (S=33.3%)<br />
Balked Landing Surface (S=3.33%)<br />
Inner Transitional Surface (S=33.3%)<br />
1410 m.<br />
600 m.<br />
6750 m.<br />
6800 m.<br />
4500 m.<br />
Fig. 4-3-1 Obstacle Limitation Surface
4.4 RUNWAY, TAXIWAY AND APRON<br />
4.4.1 Runway<br />
The number and orientation of runway(s) at an airport should be such that the<br />
usability factor of the airport is not less than 95% with a crosswind component<br />
of no more than 20 knots.<br />
As seen in Table 4.4-1, the present runway length of 2,280 m at the existing<br />
<strong>Legaspi</strong> <strong>Airport</strong> is more than sufficient for use by B737 and A320. The<br />
runway width should be increased to 45 m with 7.5-m wide shoulders on both<br />
sides in accordance with relevant recommendations of ICAO.<br />
Table 4.4-1 Standard Runway Length Requirements for<br />
Domestic Operation in Japan<br />
Design Aircraft Runway Length Requirement<br />
Large Jet Aircraft such as<br />
B747, B777, MD-11, etc.<br />
2,500 m<br />
Medium to Small Jet Aircraft such as<br />
A300, B767, MD-81, MD-87, MD-90, B737, A320<br />
2,000 m<br />
Turbo Prop. Aircraft such as<br />
YS-11<br />
1,500 m<br />
Small Prop. Aircraft such as<br />
DO-228, DHC-6, N24A, BN2A<br />
800 m to 1,000m<br />
Source: Design Standards for <strong>Airport</strong> Civil Facilities, Japan<br />
4.4.2 Taxiway and Taxiway Strip<br />
4.4.3 Apron<br />
A complete parallel taxiway is not economically desirable when the number of<br />
instrument approaches does not reach landings during the peak hour. Hence,<br />
it is not foreseen to be required at <strong>Legaspi</strong> for the identified planning periods.<br />
The required number of aircraft parking stands with sufficient allowance for<br />
aircraft overstaying is estimated based on the following formula:<br />
Where,<br />
S =<br />
S= Number of aircraft parking stands<br />
N= Number of aircraft landings<br />
T= Turn-around time (60 minutes for SJ & TP)<br />
4-9<br />
1.2 x N x T<br />
60
The width and depth of the aircraft parking stands have been determined<br />
based on the dimension and required clearances for the design aircraft, in this<br />
case A320.<br />
4.5 PASSENGER AND CARGO TERMINAL BUILDINGS<br />
4.5.1 Passenger Terminal Building<br />
The floor area required for the passenger terminal building is calculated by<br />
multiplying the number of peak-hour passengers and the required unit floor<br />
area per passenger. A unit floor area of 10 sq.m. per peak-hour passenger<br />
has been adopted for passenger terminal based on a planning practice in the<br />
Philippines.<br />
4.5.2 Cargo Terminal Building<br />
4.6 OTHER BUILDINGS<br />
The floor area of the cargo terminal building is estimated based on the annual<br />
cargo volume and unit cargo handling capacity. A handling capacity of 15<br />
tons per sq.m. is adopted for estimating the cargo handling area based on<br />
experience from other similar projects.<br />
4.6.1 Control Tower Building<br />
The control tower should be high enough to enable the controller to observe<br />
the surface of runway threshold with an angle of depression not less than 35<br />
minutes. The approximate minimum eye level of controllers will be about 23<br />
m above the ground. The floor area of the control tower will be about 300<br />
sq.m. to accommodate air traffic controllers, control consoles, staircase, and<br />
others.<br />
4.6.2 Administration Building<br />
The floor space required for administrative and operational functions will be<br />
about 660 sq.m. to accommodate 11 functional units composed of the<br />
following :<br />
a) Executive Office<br />
b) Assistant Executive Office<br />
c) Executive Staff<br />
d) Legal Staff<br />
4-10
e) Internal Audit<br />
f) Security Unit<br />
g) Medical Unit<br />
h) Airways Navigation/Air Traffic<br />
i) Aviation Safety<br />
j) Administrative Division<br />
k) Finance<br />
Each functional unit is assumed to be manned by an average of 10 persons.<br />
For planning purposes each individual is provided with 5 sq.m. of floor space<br />
and an additional 20 percent for circulation and provision for common areas.<br />
4.6.3 Fire Station Building<br />
The floor space required for fire station building will be about 270 sq.m. based<br />
on the requirement of fire fighting vehicles and the minimum space<br />
requirement for Design Category 6.<br />
4.7 ROAD AND CARPARK<br />
4.7.1 Access Road<br />
The number of road lanes and width should be established on the basis of<br />
anticipated volume of traffic to be accommodated. A two-lane, two-way road<br />
can handle 2,500 vehicles per hour, while a four-lane road with a divider can<br />
handle up to 8,800 vehicles per hour. The characteristics of the site, including<br />
the functional role of the access road, should be ascertained before a final<br />
access road design can be formulated. Whether or not the access road will<br />
be part of a by-pass road facility should be considered in the design.<br />
4.7.2 Car Park<br />
The parking demand for vehicles is estimated based on the number of twoway<br />
peak-hour passengers and unit parking demand per hourly passenger. It<br />
is assumed that each departing or arriving passenger will need on the<br />
average about 0.3 vehicle parking space for planning of the car park. A unit<br />
space of 35 sq.m. per vehicle is used to estimate the required area for the car<br />
park (see Fig. 4.7-1).<br />
4-11
4.8 AIR NAVIGATION<br />
FAA Advisory Circular 150/5360-13 recommends 31.5 to 36 sq.m. should be<br />
provided for each parked vehicle. This unit space includes parking space,<br />
driveways, sidewalks, green areas and islands within a car park.<br />
Fig. 4.7-1 Typical 20-Vehicle Capacity Parking Module Configuration<br />
For a module of 20 parking space:<br />
A = L x W<br />
A = 37 m x 18 m<br />
A = 666 sq.m.<br />
Unit space = 666 sq.m./ 20 vehicles<br />
Unit space = 33.3 sq.m./vehicle<br />
or 35 sq.m./vehicle to include sidewalks, green areas, etc.<br />
Air navigation systems, including radio navigation aids, aeronautical ground<br />
lights, meteorological observation systems, air traffic control (ATC) and<br />
aeronautical telecommunication systems should be provided to allow for<br />
precision approach category I operations. The following equipments are<br />
required for <strong>Legaspi</strong> <strong>Airport</strong>:<br />
4-12
Radio Navigation Aids<br />
a) Category I Instrument Landing System (ILS) for main approach direction<br />
b) VHF Omnidirectional Range (VOR) / Distance Measuring Equipment<br />
(DME)<br />
c) Navaids Monitoring and Control System<br />
Aeronautical Ground Lights<br />
a) Precision Approach Category I Lighting System (PALS Cat-I) including its<br />
light plane for main approach direction<br />
b) Simple Approach Lighting System (SALS) including its light plane for<br />
secondary approach direction<br />
c) Precision Approach Path Indicators (PAPI) for both runway approaches<br />
d) Runway Edge Lights, Runway Threshold and Wing Bar Lights, Runway<br />
End Lights, Stopway Lights, and Taxiway Edge Lights<br />
e) Aerodrome Beacon, Apron Flood Lights, Illuminated Wind Direction<br />
Indicators, and Obstacle Lights<br />
f) Aeronautical Ground Light Monitoring and Control System<br />
Meteorological Observation System<br />
a) Transmissiometers (Runway Visual Range) and Ceilometers for both<br />
approach directions<br />
b) Automatic Weather Observation, Data Collection, Recording and Display<br />
System<br />
c) Communication Facilities for Meteorological Services, etc.<br />
ATC and Aeronautical Telecommunication System<br />
a) VHF and HF Radio Communication Facilities and Multi-Channel Magnetic<br />
Tape Recorder as existing<br />
b) PCs inclusive of associated software for ALS & AFTN linkages<br />
c) VSAT<br />
d) Handheld transceivers<br />
e) Binoculars<br />
f) Signaling lamp (Air Traffic Light Gun)<br />
g) Siren<br />
4-13
4.9 RESCUE AND FIRE FIGHTING SERVICES<br />
The level of protection for rescue and fire fighting is determined based on the<br />
dimensions of aircraft using the airport in accordance with “<strong>Airport</strong> Service Manual Part<br />
I - Rescue and Fire Fighting” (ICAO). The category for A320 design aircraft is 6. The<br />
minimum usable amounts of extinguishing agents and fire fighting vehicles required for<br />
category 6 are as follows:<br />
Table 4.9-1 Minimum Usable Amount of Extinguishing Agents & Fire Fighting Vehicles<br />
Requirements for Category 6<br />
Min. Number of Rescue and Fire Fighting Vehicles 2<br />
Min Storage of Extinguishing Agents<br />
Water (liters)<br />
11,800<br />
Discharge Rate (Foam Solution/min)<br />
6,000<br />
Complementary Agents<br />
Dry Chemical Powder (kgs.)<br />
225<br />
4.10 AIRPORT UTILITIES<br />
The demand for airport utilities is estimated based on the average unit demands of<br />
airports and summarized in Table 4.10-1.<br />
Table 4.10-1 Unit Demand for Utilities for Planning Purposes<br />
Utilities Area of Application Unit Demand<br />
Water and<br />
Sewage<br />
Passenger Terminal Building<br />
Cargo Terminal Building<br />
Administration Building and Other Buildings<br />
23 liters/sq.m./day<br />
3 liters/sq.m./day<br />
10 liters/sq.m./day<br />
Passenger Terminal Building 0.07 kgs/sq.m./day<br />
Solid Waste Cargo Terminal Building 0.14 kgs/sq.m./day<br />
Administration Building and Other Buildings 0.14 kgs/sq.m./day<br />
Passenger Terminal Building 100 VA/sq.m.<br />
Electricity Cargo Terminal Building 60 VA/sq.m.<br />
Administration Building and Other Buildings 80 VA/sq.m.<br />
Passenger Terminal Building 0.005 extension/sq.m.<br />
Telephone<br />
Cargo Terminal Building<br />
Administration Building and Other Buildings<br />
0.005 extension/sq.m.<br />
0.025 extension/sq.m<br />
Trunk Lines<br />
25 lines<br />
Basis : Average Unit Demand from Mactan, Manila and Narita <strong>Airport</strong>s<br />
Note: Generated Sewage is assumed at 100 % of Water Consumption<br />
Secondary power supply will be estimated to provide emergency power to essential<br />
facilities and equipment at the airport to maintain operation during power failure.<br />
4-14
4.11 AVIATION FUEL SUPPLY SYSTEM<br />
Fuel consumption is estimated by multiplying the trip fuel and the number of departing<br />
flights for each aircraft type. The trip fuel for small jet and turbo prop aircraft can be<br />
approximated by the following formulae:<br />
Small Jet : TF = 0.0041 x SD + 0.75<br />
Turbo Prop : TF = 0.0010 x SD + 0.60<br />
where,<br />
TF : Trip fuel (kl)<br />
SD : Sector distance (km)<br />
The required fuel storage capacity is determined based on the requirement that the<br />
airport should have a storage capacity sufficient to provide for seven days of<br />
consumption. The tank capacity has been planned to be 1.25 times of the storage<br />
requirement.<br />
Table 4.11-1 Estimated Weekly Fuel Consumption and Required Tank Capacity<br />
Requirements 2015 2025<br />
Weekly Fuel Consumption (kl) 22 30<br />
Tank Capacity (kl) 1 x 25 2 x 25<br />
4.12 WORLD GEODETIC SURVEY 1984 (WGS-84)<br />
Realizing that accurate coordinates are critical to flight safety, the International Civil<br />
Aviation Organization (ICAO) recommend that WGS 84 (World Geodetic Survey 1984)<br />
be used as a standard datum for all international flight operations. The ICAO goal was<br />
to provide safer air transportation by using an accurate, consistent, and universally<br />
recognized geodetic reference frame for air travelers.<br />
4.12.1 Geodetic Control Stations<br />
Number of Stations: Each airport must have one Primary <strong>Airport</strong> Control<br />
Station (PACS) and at least two Secondary <strong>Airport</strong> Control Stations (SACS).<br />
Establishing three SACS is highly recommended.<br />
Location: The PACS and SACS shall be located within the airfield property<br />
and placed appropriately to support classical/conventional survey<br />
observations. The geometric figure of an equilateral quadrilateral with sides<br />
of approximately 1 kilometer should be used as a model. Consideration<br />
4-15
should be given to stability, permanence, and utility (accessibility, visibility,<br />
and potential sources of interference with GPS signals).<br />
Station Monuments:<br />
Different types of monuments will be appropriate for<br />
different locations and ground conditions on the aerodrome/heliport and it is<br />
for the surveyor, with the guidance of ATO or other legitimate authority, to<br />
decide on the most appropriate type. Additionally, investigation should be<br />
made prior to the installation of survey monuments to ensure that<br />
underground cables and services will not be affected by the installation. In<br />
order of preference, the choices for monuments of PACS and SACS are:<br />
− On bed rock<br />
− On a concrete platform or pillar<br />
− A stainless steel rod driven to refusal<br />
− A one meter spike<br />
Name: Each survey station must be assigned (and preferably labeled or<br />
stamped with) a unique name such that there is no doubt as to its provenance<br />
or identity. An unambiguous numbering system, identifying the<br />
aerodrome/heliport, year and station number should be used. The<br />
recommended naming convention is to use the last three letters of ICAO<br />
designation code and a sequential number. For example, the ICAO identifier<br />
for Ninoy Aquino International <strong>Airport</strong> is RPLL. The PACS and SACS would<br />
be named “PLL1”, “PLL 2”, and “PLL 3”. If this naming convention already<br />
exists at the airfield, the next number in the sequence should be used for<br />
newly established stations. However, guidance provided by ICAO, the ATO,<br />
or other appropriate authority should be judiciously considered in the naming<br />
process and conditions such as the use of pre-existing marks or the<br />
preferences of the entity controlling the airfield may dictate that another<br />
naming convention be used. In all cases the surveyor should avoid the<br />
practice of establishing new monuments solely to satisfy a naming<br />
convention.<br />
Labels: Uniform labels (e.g. stamped disks) may be used at individual<br />
aerodrome/heliport for all survey stations. Existing survey marks if<br />
appropriately located (refer to Location) may be used, but no changes should<br />
4-16
e made to their labeling. Any substantial topographic surface feature may<br />
also be used as a survey monument, provided the feature is clearly marked to<br />
identify the exact point of survey. All stations should be defined to within +<br />
0.002 meter and the station name should be clearly evidenced in stamping,<br />
durable paint or other durable medium.<br />
4.12.2 Airfield Features<br />
Runway Points: The 3-dimensional positions of runway ends, threshold ends,<br />
overrun (stopway) ends, the touchdown zone elevation (TDZE) and a vertical<br />
profile of the runway must be determined. Generally 4 points along the<br />
centerline of the runway (at a separation of not less than 10% of runway<br />
length) produces and adequate runway vertical profile as long as the plane of<br />
the vertical gradient between any two adjacent published runway points does<br />
not depart by more than one foot from the runway surface.<br />
Instrument Landing System (ILS): The 3-dimensional positions of all ILS<br />
components must be determined. The ILS normally consists of the following<br />
electronic components: Localizer, Glide Slope (GS), Outer Marker, Middle<br />
Marker, Inner Marker and Compass Locator. NOTE: The point of survey for<br />
an end fire type glide slopes is different from that of traditional glide lopes.<br />
End fire type glide slopes are primarily used along the coastline, as they take<br />
into account tidal effects. These glide slopes are considerably larger than<br />
traditional glide slopes.<br />
Microwave Landing System (MLS): The 3-dimensional positions of all MLS<br />
components must be determined.<br />
Terminal Navigation Aids: The 3-dimensional positions of all Terminal<br />
Navigation Aids will be surveyed.<br />
Visual NAVAIDs:<br />
The latitude and longitude of all Visual NAVAIDSs must be<br />
determined.<br />
The position of a “plot point(s)” shall be determined for certain electronic and<br />
visual NAVigational AIDs (NAVAIDs). The term “plot point” is understood to<br />
be a unique coordinate position that is determined by either geodetic survey<br />
of by photogrammetric means. The “plot point” may be the center of the<br />
NAVAID, or when the NAVAID is composed of more than one unit, the center<br />
of the array, or in the case of an approach light systems, the first and last<br />
4-17
lights. A position, and sometime an elevation, depending on the NAVIAD,<br />
shall be determined for the selected electronic NAVAIDs associated with the<br />
airport. The horizontal and vertical plot point for electronic NAVAIDs are listed<br />
in Plot Points of NAVAIDs Table (Annex E).<br />
Plot points shall be collected for all required visual NAVAIDs; NAVAIDs and<br />
their “plot points” are identified in Plot Points of NAVAIDs Table. Reminder:<br />
Elevations are not required for visual NAVAIDs.<br />
Glide Slope Abeam Point: The abeam point is a calculated location. It is<br />
defined as the point on the runway centerline at which the physical location of<br />
the pint on the runway centerline at which the physical location of the point<br />
survey on the Glide Slope device lies perpendicular to the runway centerline.<br />
The height of this point will be interpolated from the runway end, threshold,<br />
and/or profile information as appropriate.<br />
Runway Crown and <strong>Airport</strong> Elevation: The highest point on each runway and<br />
the highest point of all the usable runway surfaces must be determined.<br />
Obstructions/Obstacles:<br />
the 3-dimensional position of objects limiting or<br />
impending non-precision area navigation approach and departure must be<br />
determined. Diagram of the areas of concern surrounding the runway and the<br />
arbitrary heights of obstacles must be presented. The controlling<br />
obstructions/obstacles must be surveyed to the absolute accuracy specified in<br />
Precision Table (Annex F) and the relative accuracy specified in the Accuracy<br />
Table (Annex G). All other objects/obstructions shall be surveyed.<br />
4.12.3 Frangible Objects<br />
All frangible objects are not covered under this program. Frangible objects<br />
are objects designed to breakaway such as, runway marker signs, taxiway<br />
signs, wind socks, anemometers, approach light systems, etc. Do not survey<br />
frangible navigational aids (except those in Airfield Features), meteorological<br />
apparatus, parked aircraft, and mobile or temporary objects (i.e. construction<br />
equipment, dirt/debris piles, etc.).<br />
4.12.4 Survey Accuracy and Precision<br />
Accuracy: The accuracy requirements are expressed (root sum square of the<br />
accumulated process errors), per component (latitude, longitude, and ellipsoid<br />
4-18
height), 90% confidence region, to include the accuracy of the NIMA<br />
recognized WGS 84 fiducial station. (Accuracy Table)<br />
Precision: The precision requirements are expressed (root sum square of the<br />
accumulated process errors less the absolute accuracy estimate of the PACS)<br />
per component (latitude, longitude, and ellipsoid height), 90% confidence<br />
region, with respect to the PACS. (Precision Table)<br />
4.12.5 Survey Data Acquisition Report/Publication<br />
A document containing the final results relating to any surveyed portion of the<br />
project must be produced ad should contain the following information:<br />
1) A table containing the results for each object positioned during the<br />
project.<br />
Note: All accuracy values are estimates of absolute accuracy with<br />
respect to WGS 84. The table shall include the following information:<br />
a) A unique point identifier (name)<br />
b) An abbreviated description of the object positioned<br />
c) The WGS 84 latitude (DD MM SS.SSS)<br />
d) The Latitude hemisphere (N/S)<br />
e) The WGS 84 Longitude (DDD MM SS.SSS)<br />
f) The Longitude hemisphere (E/W)<br />
g) The WGS 84 Ellipsoid height (meters) (MMMM.MMM)<br />
h) The WGS 84 Ellipsoid height (feet) (FFFF.FF)<br />
i) The EMG96 Orthometric height (meters) (MMMM.MMM)<br />
j) The EMG96 Orthometric height (feet) (FFFF.FF)<br />
k) The Latitude accuracy (WGS 84 absolute accuracy mmm.mmm)<br />
l) The Longitude accuracy (WGS 84 absolute accuracy mmm.mmm)<br />
m) The Ellipsoid height accuracy (mmm.mmm)<br />
4-19
2) A narrative containing the following information:<br />
a) The method used to establish WGS 84 control including the names<br />
of WGS 84 control stations used.<br />
b) A description of the method(s) used to extend control to all other<br />
points.<br />
c) Describe the equipment, procedures, and software used in the<br />
performance of the survey.<br />
d) If GPS, describe the collection scenarios, and epoch intervals used.<br />
e) Events or conditions witnessed during the data acquisition phase that<br />
may bear on the validity of the data.<br />
3) A description of the computational process including:<br />
a) A comprehensive account of the GPS vector processing or<br />
classical/conventional surveying calculations. The software name,<br />
version number, and relevant optional settings should be discussed.<br />
b) A comprehensive account of the least square adjustment process<br />
including analysis of the variance/covariance matrices. The software<br />
name, version number, weighting and weighting rationale should be<br />
discussed.<br />
c) An accounting of precision values with respect to the PACS (as<br />
specified by FAA or ICAO as applicable) is required. The information<br />
may be presented in the form of certification that all precision<br />
requirement were met, by exception, or in tabular format as<br />
appropriate.<br />
d) Other technical, historical, administrative, logistical or other<br />
information bearing on the quality of the data or the completion of the<br />
project. Sketches, diagrams, detailed station descriptions,<br />
photographs, maps, electronic files (the installation GIS for example)<br />
and other documents should be provided if acquired during the<br />
course of the project.<br />
4-20
4.13 AERODROME DATA<br />
4) A copy of all raw data collected on the project and copies of all<br />
intermediate files produced during the process.<br />
Aerodrome data in accordance with ICAO Annex 15, Doc. 8126, and the Aeronautical<br />
Information Publication (AIP) including associated charts (Aerodrome Obstacle Chart<br />
ICAO Type A/B/C, Aerodrome Chart, Aerodrome Ground Movement Chart and Aircraft<br />
parking/Docking Chart) shall be provided in written and electronic form (hard/soft<br />
copy). Charts shall be in AutoCAD file.<br />
4-21
Chapter 5 DEVELOPMENT STRATEGY AND SELECTION OF NEW<br />
AIRPORT SITE<br />
5.1 REVIEW OF DEVELOPMENT STRATEGIES<br />
5.1.1 General<br />
Considering the planning parameters and prevailing conditions detailed in the<br />
preceding sections of the Report, the emerging development strategies are<br />
the following:<br />
a) Option I : Improving the Existing <strong>Legaspi</strong> <strong>Airport</strong> Facilities<br />
b) Option II : Developing a <strong>New</strong> <strong>Airport</strong> to Serve both <strong>Legaspi</strong> and<br />
Naga City (<strong>New</strong> Southern Luzon <strong>Airport</strong>); and,<br />
c) Option III : Developing a <strong>New</strong> <strong>Legaspi</strong> <strong>Airport</strong>.<br />
Option I involves improving the existing facilities at <strong>Legaspi</strong> <strong>Airport</strong> to<br />
upgrade its level of service in accordance with ICAO requirements for<br />
Precision Approach Runway Code 4C for the short-term. Option I recognize<br />
the operational restrictions prevailing at Naga <strong>Airport</strong> and should be treated<br />
separately. Naga <strong>Airport</strong> is experiencing dramatic decrease in traffic demand<br />
on account of stiff competition with road transportation after the completion of<br />
Quirino Highway. Necessarily, the requirements of Naga <strong>Airport</strong> should be<br />
established in a separate study if Option I is pursued.<br />
Option II recognizes simultaneously the operational restrictions in both<br />
<strong>Legaspi</strong> and Naga <strong>Airport</strong>s. By developing a new airport midway between the<br />
existing facilities in <strong>Legaspi</strong> and Naga, it aims to save on development cost<br />
arising from two separate improvement activities. Option II involves a smallscale<br />
development of Sorsogon airport to make it more responsive to<br />
unserved demand from the southern part of Region V once the existing<br />
<strong>Legaspi</strong> <strong>Airport</strong> is decommissioned.<br />
Option III envisions the relocation of the existing <strong>Legaspi</strong> <strong>Airport</strong>, independent<br />
of the requirements of Naga <strong>Airport</strong>. Similar to Option I, it also recognizes the<br />
need for a separate consideration of the requirements of Naga <strong>Airport</strong>.<br />
5-1
5.1.2 Implications of Option I (Improving the Existing <strong>Legaspi</strong> <strong>Airport</strong><br />
Facilities)<br />
This strategy requires the doubling of the existing runway strip and shifting the<br />
aircraft-parking apron together with the terminal facilities to satisfy the<br />
requirements of the precision approach runway. A possible scheme for<br />
general development, while keeping the airport operational, is shown in<br />
Figure 5.1-1.<br />
The existing runway at the <strong>Legaspi</strong> <strong>Airport</strong> is more than enough to<br />
accommodate domestic operation of A320, and B737 if obstacles surrounding<br />
the airport are removed. Improving the runway for precision approach may be<br />
undertaken by shortening the runway to 2,000-m so that the 300-m wide<br />
runway strip, together with the localizer area and runway end safety area<br />
could be established without diverting the nearby Yawa river. However, a<br />
portion of the Bagtang river and the road located at the southern end of the<br />
airport need to be diverted, together with other roads in the vicinity. The<br />
terminal facilities including aircraft parking apron would need to be<br />
redeveloped beside the existing terminal area with adequate separation<br />
distance from the runway centerline.<br />
The precision approach will be established for Rwy 06, and one (1) set of<br />
Instrument Landing System (ILS), consisting of localizer and glide path/DME<br />
should be installed. In order to ensure adequate signal performance of the<br />
equipment, the localizer (to be located at the northern end of the runway) and<br />
glide path critical areas should be provided and properly graded. Rwy 24-end<br />
should be displaced to the south by 300-m to accommodate the localizer<br />
critical area and avoid diversion of the Yawa river. The glide path critical area<br />
would be provided along the southwestern part of the expanded runway strip.<br />
However, due to the existing alignment of the Manila-<strong>Legaspi</strong> railway, the<br />
length of the precision approach lighting system would be limited to<br />
approximately 500-m which could result in operational limitation of the ILS<br />
approach procedure.<br />
5-2
3<br />
4<br />
6<br />
2+180<br />
2+100<br />
2+000<br />
1+900<br />
1+800<br />
1+700<br />
1+600<br />
1+500<br />
1+400<br />
1+300<br />
1+200<br />
1+100<br />
1+000<br />
0+000<br />
0+800<br />
0+700<br />
0+600<br />
0+500<br />
0+400<br />
0+300<br />
0+200<br />
0+100<br />
0+000<br />
-0+100<br />
GP/DME<br />
RUNWAY STRIP 2120 x 300m<br />
YAWA RIVER<br />
TO LEGASPI CITY<br />
EXISTING AIRPORT BOUNDARY<br />
OLD APRON<br />
LLZ<br />
PAPI<br />
BUGTONG<br />
PALS<br />
RWY 2000 x 45m<br />
PAPI<br />
EXISTING AIRPORT BOUNDARY<br />
5-3<br />
RIVER<br />
APRON<br />
200 x 100m<br />
DVOR/DME<br />
LEGEND:<br />
1 Passenger Terminal Building<br />
2 Cargo and PAL Office Building<br />
3 Control Tower and ATO Administration Building<br />
4 Fire Station<br />
5 ATO Power House - 1<br />
6 ATO Power House - 2<br />
7 PAL Power House<br />
8 Aviation Security Command Building<br />
9 PAGASA Building<br />
10 Concessions<br />
11 PAL Fuel Farm<br />
TO LEGASPI CITY<br />
11<br />
NEW APRON<br />
10<br />
NEW TERMINAL<br />
TO LEGASPI CITY<br />
9 8 5 10 1 2 7<br />
0 50 100 250 500m<br />
Fig. 5.1-1 Alternative Development Option: Existing <strong>Airport</strong>
5.1.3 Implications of Option II (Developing the <strong>New</strong> Southern Luzon <strong>Airport</strong>)<br />
The potential sites are located in the provinces of Camarines Sur and Albay,<br />
bounded by several mountains such as Mt. Isarog, Mt. Iriga, Mt. Masaraga<br />
and Mt. Mayon, with the highest elevations all exceeding 1,000-m AMSL.<br />
Along the western coast from south of Pamolano to the north of Pio Duran,<br />
are hilly terrains with elevations of up to around 500-m AMSL. In between<br />
these mountains and hilly terrains are low and flat flood plains near the vicinity<br />
of Lake Baao and Lake Bato, some rivers, creeks and rice paddies (around<br />
the municipalities of Baao, Nabua, Bato and Libon). Flat areas with relatively<br />
higher elevations (30 to 40-m AMSL) can be found near the boundary of<br />
Nabua and Bato. Another flat area exists near the boundary of Guinobatan<br />
and Pio Duran, which however is considered inaccessible from both <strong>Legaspi</strong><br />
and Naga. Shown in Figure 5.1-2, the potential sites identified in the previous<br />
study and confirmed under the present study are located in:<br />
a) Site 1 - Barangay Salvacion, Iriga City;<br />
b) Site 2 - Barangay Cotnogan, Libon; and<br />
c) Site 3 - Barangay Balangiban, Polangui.<br />
Because of the mountains and volcano located on the northeast and<br />
southeastern part of Bicol Region, the eastern airspace is not usable at all for<br />
the proposed <strong>New</strong> Southern Luzon <strong>Airport</strong>. In addition, to satisfy obstacle<br />
clearance requirements, runway orientation needs to be directed from the<br />
northwest to southeast, which is very likely to be totally inconsistent with the<br />
prevailing wind direction of northeast to southwest. Thus, a completely<br />
crosswind runway will result under this condition. Table 5.1-1 summarizes<br />
the result of the evaluation of these three (3) sites.<br />
The distribution of active faults in the Bicol Region is shown in Figure 5.1-3.<br />
An active fault called “Lake Bato Lineament” lies along the western coast<br />
where hilly terrain exists. Another fault is located further down along the<br />
southwestern coastline of Albay and Sorsogon Provinces. While most of the<br />
alternative sites are outside the potential effect of Mayon Volcano, they are<br />
near the two identified major faults and, therefore, within seismic sensitive<br />
areas.<br />
5-4
5-5<br />
Fig. 5.1-2 Potential Sites for Alternative Development Option II
Table 5.1-1 Evaluations of Potential Sites for Development Option II<br />
Potential Sites<br />
Criteria<br />
Balangiban, Polangui<br />
Cotnogan, Libon<br />
Salvacion, Iriga City<br />
Several hills in the northeastern part of<br />
the site pose an obstruction to aircraft<br />
operation. To avoid those obstacles,<br />
the runway orientation will be<br />
northwest-southeast direction. Holding<br />
track pattern will be on the<br />
southwestern side of the runway, as<br />
those hills protrudes on the<br />
northeastern part of the inner<br />
horizontal surface.<br />
The presence of Mt. Iriga (1, 100<br />
AMSL), Mt. Malihao (1,458 AMSL)<br />
and Mt. Masaraga (1,328 AMSL) on<br />
the northeastern part of the site limits<br />
the runway orientation to northwestsoutheastern<br />
direction. Horizontal<br />
inner surface will be free from<br />
obstruction, however, holding track<br />
pattern will be limited on the<br />
southwestern side of the runway.<br />
The horizontal surface is free from<br />
obstacles. About 12 km. northeast of<br />
the site is Mt. Iriga with an elevation<br />
of 1,100 AMSL. The runway will be<br />
oriented towards northwest-southeast<br />
direction to avoid obstacle on the<br />
approach and take-off surfaces.<br />
Air Space<br />
During the site reconnaissance, the<br />
prevailing wind in the site is similar<br />
with Site 1 and 2; this is considered a<br />
crosswind direction.<br />
The runway orientation on this site is<br />
perpendicular to the prevailing wind<br />
on the area. This is considered to be<br />
a crosswind direction.<br />
The prevailing wind in the site was<br />
observed to be northeast- southwest<br />
direction. The desired orientation of<br />
the runway will be perpendicular to<br />
the prevailing wind direction.<br />
Wind Direction<br />
5-6<br />
The general topography of the site is<br />
relatively flat with elevation ranging<br />
from 16 m to 18 m. The site was<br />
noted to be part of the area<br />
considered lowland and prone to<br />
floods.<br />
The area was observed to be rolling<br />
with difference in elevation<br />
approximately 20 m due to relatively<br />
high with average elevation of 75<br />
AMSL, the probability of flooding is<br />
Low. This site will require massive<br />
volume of earthwork.<br />
The site is basically a flat land,<br />
gradually sloping to the north where<br />
the Iriga river system is located. Due<br />
to relatively high elevation of 35<br />
AMSL, the site was said to be free<br />
from flood in the past. Expected<br />
volume of earthworks will be minimal<br />
Topography<br />
The site is approximately 40 km. from<br />
<strong>Legaspi</strong> City and 20 km. from Naga<br />
City. The site can be reached via the<br />
well-paved road National Highway<br />
No. 1 in 45 minutes and 25 minutes<br />
time from <strong>Legaspi</strong> City and Naga City<br />
respectively.<br />
The site is approximately 50 km. from<br />
<strong>Legaspi</strong> City and 60 kms. from Naga<br />
City by road. Travel time would be<br />
about 60 minutes and 20 minutes<br />
respectively via the well- paved<br />
National Highway No. 1.<br />
The site is approximately 60 km. from<br />
<strong>Legaspi</strong> City and 50 kms. from Naga<br />
City by road. Travel time to the site is<br />
about 70 minutes from <strong>Legaspi</strong> and<br />
60 minutes from Naga Cities via the<br />
well- paved National Highway No. 1<br />
Accessibility
Table 5.1-1 Evaluations of Potential Sites for Development Option II (Cont’d)<br />
Potential Sites<br />
Criteria<br />
Balangiban, Polangui<br />
Cotnogan, Libon<br />
Salvacion, Iriga City<br />
The area is an agricultural land<br />
principally planted with rice. It is also<br />
fully irrigated. Therefore, the area is<br />
considered a prime agricultural land.<br />
The site was observed to be<br />
agricultural, (mostly planted with<br />
coconut) and graze land for cattle<br />
raising.<br />
Prevailing land uses in the area was<br />
noted to be agricultural, i.e., mostly<br />
planted with rice and coconut. The<br />
area is irrigated and considered to be<br />
a prime land.<br />
Land Use<br />
Some houses will be directly affected<br />
by airport construction. Due to the<br />
desirable runway orientation and its<br />
proximity to town proper of Polangui,<br />
Aircraft noise influence is expected.<br />
Several houses and school will be<br />
affected by the airport construction,<br />
thus; needs to be relocated. No<br />
aircraft noise influence is expected<br />
from major urban centers<br />
Necessary relocation will be required<br />
for some houses along the Iriga-Bato<br />
highway and farmers housed at the<br />
site, which will be directly affected by<br />
airport construction. No aircraft<br />
noised influence is expected for<br />
major urban centers.<br />
Environmental<br />
Factor<br />
5-7<br />
A substantial cost will be required for<br />
the diversion of existing two series or<br />
power line that run across the site.<br />
Some irrigation canals will also need<br />
to be diverted.<br />
The barangay road (macadam<br />
surfaced) will need to be diverted or<br />
relocated as it will be directly affected<br />
by the airport construction<br />
A portion of the Bato-Iriga highway<br />
including power line will have to be<br />
diverted. Some irrigation canal will<br />
also need to be diverted<br />
Others
Site 1<br />
Site 2<br />
Fig. 5.1-3 Distribution of Active Faults in Bicol Region<br />
5-8<br />
Site 3
5.1.4 Implication of Option III (Developing a <strong>New</strong> <strong>Legaspi</strong> <strong>Airport</strong>)<br />
The development of a <strong>New</strong> <strong>Legaspi</strong> <strong>Airport</strong> envisions the decommissioning of<br />
the existing facility and relocating to a new site, where the operational<br />
restrictions in the existing airport can be most economically addressed, with<br />
minimum social dislocation. In the reconnaissance survey, the four (4) sites<br />
identified in the previous study were confirmed to be feasible areas for<br />
development considering a multi-objective selection process. The location of<br />
potential areas for development, shown in Figure 5.1-4, were identified to be<br />
in:<br />
a) Site 4 - Barangay Alobo, Daraga City<br />
b) Site 5 – Barangay Villahermosa, Daraga City<br />
c) Site 6 – Barangay Bariis, <strong>Legaspi</strong> City<br />
d) Site 7 – Barangay Borabod, Castilla<br />
A brief assessment of these sites is summarized in Table 5.1-2. On the basis<br />
of the selection criteria enumerated in Table 5.1-2, the two most desirable<br />
sites emerged to be in Barangay Alobo and Barangay Bariis. The comparison<br />
between the two sites is covered in more detail in the succeeding section.<br />
5-9
5-10<br />
Fig. 5.1-4 Potential Sites for Development Option III
Borabod, Castilla, Sorsogon<br />
Table 5.1-2 Evaluations of Potential Sites for Development Option III<br />
Potential Sites<br />
Alobo, Daraga, Albay Villahermosa, Daraga, Albay Bariis, <strong>Legaspi</strong> City<br />
Criteria<br />
There are no obstacles for<br />
approach and take-off surfaces.<br />
However, there are several hills<br />
protruding upon both the<br />
eastern and western parts of<br />
horizontal surface<br />
There are no obstructions on<br />
approach and take-off surfaces.<br />
The inner horizontal surface is<br />
free from obstacles. The hilly<br />
terrain protrudes the conical<br />
surface on the northeastern part<br />
of the runway but no significant<br />
influence to aircraft operation by<br />
establishing the holding track<br />
pattern on the western side of<br />
the runway<br />
There are no obstacles on<br />
approach and take-off surfaces.<br />
The hilly terrain on the<br />
northwestern part poses an<br />
obstruction on the inner<br />
horizontal surface but there will<br />
be no adverse effect on aircraft<br />
operation if the holding track<br />
pattern is established on the<br />
southeastern side of the<br />
runway.<br />
No obstacles for approach and<br />
take-off surfaces. The<br />
northwestern part of the<br />
horizontal surface is obstructed<br />
by hilly terrain, but no adverse<br />
effect on aircraft operation if the<br />
holding track pattern is<br />
established on the southeastern<br />
side. A hill with a 30-m. tower<br />
and antenna protrudes upon the<br />
southeastern portion of the<br />
conical surface by about 110 m.<br />
Air Space<br />
The runway orientation will be<br />
adequate for prevailing wind<br />
The runway orientation is<br />
adequate for the prevailing wind<br />
in the area.<br />
Runway orientation will be<br />
adequate for the prevailing wind<br />
direction in the area.<br />
Northeast to southwest runway<br />
orientation will be adequate for<br />
the prevailing wind direction.<br />
Wind Direction<br />
5-11<br />
The site is generally flat with an<br />
average elevation of almost 50<br />
AMSL. The probability of flood<br />
is low.<br />
The general topography of the<br />
site is undulated with varying<br />
elevations of up to 15 m.<br />
difference. This will require a<br />
substantial volume of earthwork,<br />
but cut and fill can be balance at<br />
site. The site is about 130 m.<br />
AMSL, with minimal probability<br />
of flood.<br />
The terrain is undulated with<br />
varying elevations of up to15 m.<br />
in difference. This will require a<br />
large volume of earthwork but<br />
cut and fill can be balance. With<br />
an average elevation of about<br />
20 AMSL, the probability of<br />
flooding is low.<br />
The site is basically flat with an<br />
average elevation. of about 90<br />
AMSL. Considerable volume of<br />
earthwork will be needed for<br />
airport construction.<br />
Topography<br />
The site is 34 km. by road from<br />
<strong>Legaspi</strong> City, approximately a<br />
40-minute drive. From<br />
Sorosogon City it is 25 km away<br />
(or a 30-minute drive)<br />
The road distance from <strong>Legaspi</strong><br />
City is 27 km, approximately a<br />
35 -minute drive. From<br />
Sorsogon it is also 35 km by<br />
road (or a 35-minute drive)<br />
The distance from <strong>Legaspi</strong> City<br />
is 19 km. by road and from<br />
Sorsogon City is 35 km. Travel<br />
time is approximately 25 mins.<br />
and 40 mins. from <strong>Legaspi</strong> City<br />
and Sorsogon City,<br />
respectively.<br />
Site is 12 km. by road from<br />
<strong>Legaspi</strong> City, approximately 20<br />
minutes drive via Daraga town<br />
proper. Road distance from<br />
Sorsogon City is approximately<br />
48 kms. or a 60- min trip.<br />
Accessibility
Table 5.1-2 Evaluations of Potential Sites for Development Option III (Cont’d)<br />
Potential Sites<br />
Criteria<br />
Borabod, Castilla, Sorsogon<br />
Bariis, <strong>Legaspi</strong> City<br />
Villahermosa, Daraga, Albay<br />
Alobo, Daraga, Albay<br />
The existing land use in the area The area is devoted to coconut The land use prevailing in the The land use prevailing in the<br />
is agricultural and devoted to rice plantation and covered by area is a mixed coconut and area is agricultural, and devoted<br />
plantation. Reports stated that a Comprehensive Agrarian Reform grass the area is also covered by to rice land. The irrigation<br />
study for irrigation on the area Program. (CARP).<br />
Comprehensive Agrarian Reform system on the area is not<br />
was previously conducted.<br />
Program (CARP).<br />
functioning<br />
However, during the site<br />
reconnaissance the area was<br />
noted to be not irrigated.<br />
Land Use<br />
The social impact from Several houses will be directly<br />
resettlement is minimal as it was affected by airport construction,<br />
noted that the area is thinly requiring a large-scale<br />
populated. No aircraft noise resettlement plan. No aircraft<br />
problem on urban centers is noise problem is expected on<br />
expected. However, a relocation major urban centers<br />
site is located near the north<br />
portion of the approach. Actual<br />
extent of relocation site needs<br />
confirmation.<br />
Minimal resettlement is required<br />
since the area is thinly<br />
populated. No aircraft noise<br />
influence is expected to major<br />
urban centers<br />
Some houses will be directly<br />
affected by airport construction<br />
and need to be relocated. No<br />
aircraft noise influence is<br />
expected on major urban<br />
centers.<br />
Environmental<br />
Factor<br />
5-12<br />
The runway will cross an existing The runway will run across an Diversion of existing power line<br />
power line; necessary diversion existing road; thus, diversion is on the northern part of the site is<br />
of the power line is required. required.<br />
required. The runway will crossexisting<br />
waterways and needs to<br />
diverted<br />
The runway crosses the<br />
barangay road, diversion is<br />
required. The site is<br />
complementary to future urban<br />
expansion of Metro <strong>Legaspi</strong>.<br />
Others
5.2 EVALUATION OF ALTERNATIVE STRATEGIES<br />
5.2.1 Development Option I<br />
In summary, the implementation of Option I as a development strategy will<br />
involve:<br />
a) Shortening of the existing runway to accommodate localizer and<br />
runway-end safety area;<br />
b) Diversion of Bagtang river and the national road;<br />
c) Relocation of terminal facilities and apron to provide adequate<br />
separation distance from the runway centerline;<br />
d) Acquisition of about 65.81 hectares of prime urban land valued at<br />
PhP3.29 billion (at estimated prevailing market value of PhP 5,000 per<br />
sq.m. for land and on-site developments, to be validated); and<br />
e) Removal of obstacles for unconstrained approach procedure involving<br />
22 million cu.m. of earthworks valued at approximately PhP 2.2 billion<br />
(PhP100.00 per cu.m.)<br />
Option I will have to contend with the noise pollution imposed on a heavily<br />
built-up urban center around the airport, characterized by mixed<br />
developments of commercial, residential, academic and other institutions. In<br />
addition, on the basis of hazards zoning by PhiVolcs, hazards due to the<br />
Mayon Volcano have already covered the boundaries of <strong>Legaspi</strong> <strong>Airport</strong> and<br />
is projected to further grow and intensity in magnitude.<br />
Finally, since the precision approach lighting system is limited to only about<br />
500m, its reliability will be jeopardized.<br />
5.2.2 Development Option II<br />
Development Option II is deemed to be technically undesirable on account of<br />
the surrounding geographic constraints. The topographic features of the<br />
general area render the eastern air space unusable for air navigation. If<br />
obstacle clearances are satisfied, a completely crosswind runway configuration<br />
will result, which is not an optimal orientation from the viewpoint of safety and<br />
operational efficiency. Lastly, the airport will be located in seismic sensitive<br />
areas due to the presence of active faults along the western coast.<br />
5-13
5.2.3 Development Option III<br />
Option III provides a technical solution to the limitations present in Option I<br />
and Option II. As it involves relocating to a new site, more flexibility is accorded<br />
to the extent that the chosen site will allow. Option III entails the following:<br />
a) About 48.69 hectares of land made available for urban development<br />
(estimated value of PhP3.9 Billion @ PhP8,000 / sq.m., to be validated);<br />
b) Acquisition of about 160 hectares of raw land (estimated value of PhP<br />
16 million @ PhP10 / sq.m., to be validated); and<br />
c) Development of new airport facilities of international standards.<br />
In view of the foregoing reasons, Option III (The <strong>New</strong> <strong>Legaspi</strong> <strong>Airport</strong> Project)<br />
is the development strategy proposed for implementation. The choices<br />
among the potential sites were narrowed down to two (2), namely: Barangay<br />
Alobo in Daraga and Barangay Bariis in <strong>Legaspi</strong> City.<br />
5.3 COMPARATIVE ANALYSIS OF SELECTED SITES FOR NEW LEGASPI AIRPORT<br />
The sites in Barangay Alobo, Daraga City and Barangay Bariis, <strong>Legaspi</strong> City are both<br />
capable of accommodating a runway orientation adequate for the prevailing wind,<br />
along the northeast-southwest direction.<br />
5.3.1 Barangay Alobo, Daraga, Albay<br />
Location and Accessability<br />
The site is about 12 kms west of <strong>Legaspi</strong> City, in the Municipality of Daraga.<br />
The proposed runway’s southwest end would be located close to the<br />
boundary of the municipalities of Daraga and Camalig. The northeast end<br />
would be proximate to the national highway linking Barangays De La Paz and<br />
Burgos.<br />
From <strong>Legaspi</strong> City, access to the site is via a two-lane provincial road of about<br />
eight (8) kilometers in length, passing through Daraga town proper and then<br />
through Barangay Penafrancia. The provincial road gets off to a partially<br />
paved eight-kilometer national road, passing through Barangays Gapo and<br />
Inarado before leading to the site.<br />
5-14
Site Topography and Drainage<br />
The site topography is generally flat with mean elevation of about 90m AMSL.<br />
It is planted with rice, with some patches of fruit-bearing trees and coconut.<br />
The area is drained by the Abagao River to the north, Abagao River to the<br />
west and Jovellar River to the south.<br />
Land Use and Proximity to Built-Up Areas<br />
The site is an agricultural, rain-fed rice land. There is no irrigation in the site<br />
and its productivity is low. There are about 20 to 30 nipa houses, presumably<br />
owned by farmers/caretakers of the rice field within the proposed site. The<br />
nearest community is about a kilometer north of the proposed area in<br />
Barangay Dela Paz.<br />
Obstacle Assessment for Airspace Utilization<br />
At the site in Barangay Alobo, small portions of hilly terrain protrude along the<br />
approach surface, as well as the inner horizontal and conical surfaces. The<br />
obstructions on the approach surfaces, however, can be excavated and<br />
utilized as borrow materials for site development works. The holding track<br />
pattern may have to be limited to the southern side of the aerodrome due to<br />
obstructions on the northern side. A small obstruction is also found along the<br />
northeastern side of the aerodrome (Figure 5.3-1).<br />
5-15