New Legaspi Airport Draft FS - PPP Center
New Legaspi Airport Draft FS - PPP Center
New Legaspi Airport Draft FS - PPP Center

You also want an ePaper? Increase the reach of your titles
YUMPU automatically turns print PDFs into web optimized ePapers that Google loves.
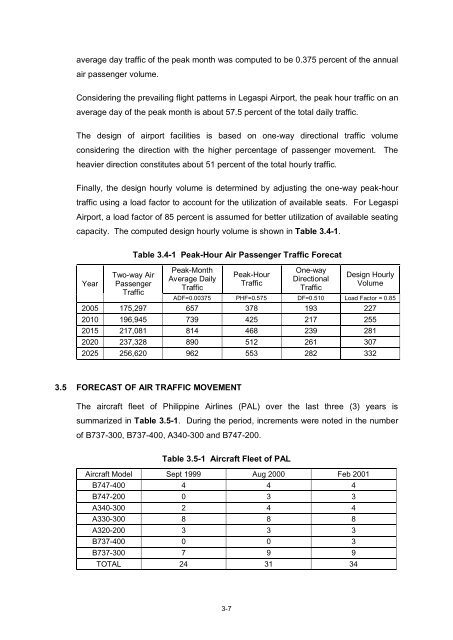
average day traffic of the peak month was computed to be 0.375 percent of the annual<br />
air passenger volume.<br />
Considering the prevailing flight patterns in <strong>Legaspi</strong> <strong>Airport</strong>, the peak hour traffic on an<br />
average day of the peak month is about 57.5 percent of the total daily traffic.<br />
The design of airport facilities is based on one-way directional traffic volume<br />
considering the direction with the higher percentage of passenger movement. The<br />
heavier direction constitutes about 51 percent of the total hourly traffic.<br />
Finally, the design hourly volume is determined by adjusting the one-way peak-hour<br />
traffic using a load factor to account for the utilization of available seats. For <strong>Legaspi</strong><br />
<strong>Airport</strong>, a load factor of 85 percent is assumed for better utilization of available seating<br />
capacity. The computed design hourly volume is shown in Table 3.4-1.<br />
Year<br />
Table 3.4-1 Peak-Hour Air Passenger Traffic Forecat<br />
Two-way Air<br />
Passenger<br />
Traffic<br />
Peak-Month<br />
Average Daily<br />
Traffic<br />
3-7<br />
Peak-Hour<br />
Traffic<br />
One-way<br />
Directional<br />
Traffic<br />
Design Hourly<br />
Volume<br />
ADF=0.00375 PHF=0.575 DF=0.510 Load Factor = 0.85<br />
2005 175,297 657 378 193 227<br />
2010 196,945 739 425 217 255<br />
2015 217,081 814 468 239 281<br />
2020 237,328 890 512 261 307<br />
2025 256,620 962 553 282 332<br />
3.5 FORECAST OF AIR TRAFFIC MOVEMENT<br />
The aircraft fleet of Philippine Airlines (PAL) over the last three (3) years is<br />
summarized in Table 3.5-1. During the period, increments were noted in the number<br />
of B737-300, B737-400, A340-300 and B747-200.<br />
Table 3.5-1 Aircraft Fleet of PAL<br />
Aircraft Model Sept 1999 Aug 2000 Feb 2001<br />
B747-400 4 4 4<br />
B747-200 0 3 3<br />
A340-300 2 4 4<br />
A330-300 8 8 8<br />
A320-200 3 3 3<br />
B737-400 0 0 3<br />
B737-300 7 9 9<br />
TOTAL 24 31 34