New Legaspi Airport Draft FS - PPP Center
New Legaspi Airport Draft FS - PPP Center
New Legaspi Airport Draft FS - PPP Center

Create successful ePaper yourself
Turn your PDF publications into a flip-book with our unique Google optimized e-Paper software.
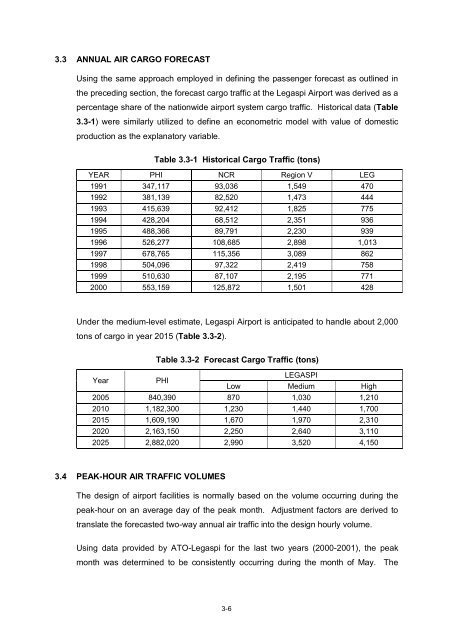
3.3 ANNUAL AIR CARGO FORECAST<br />
Using the same approach employed in defining the passenger forecast as outlined in<br />
the preceding section, the forecast cargo traffic at the <strong>Legaspi</strong> <strong>Airport</strong> was derived as a<br />
percentage share of the nationwide airport system cargo traffic. Historical data (Table<br />
3.3-1) were similarly utilized to define an econometric model with value of domestic<br />
production as the explanatory variable.<br />
Table 3.3-1 Historical Cargo Traffic (tons)<br />
YEAR PHI NCR Region V LEG<br />
1991 347,117 93,036 1,549 470<br />
1992 381,139 82,520 1,473 444<br />
1993 415,639 92,412 1,825 775<br />
1994 428,204 68,512 2,351 936<br />
1995 488,366 89,791 2,230 939<br />
1996 526,277 108,685 2,898 1,013<br />
1997 678,765 115,356 3,089 862<br />
1998 504,096 97,322 2,419 758<br />
1999 510,630 87,107 2,195 771<br />
2000 553,159 125,872 1,501 428<br />
Under the medium-level estimate, <strong>Legaspi</strong> <strong>Airport</strong> is anticipated to handle about 2,000<br />
tons of cargo in year 2015 (Table 3.3-2).<br />
Table 3.3-2 Forecast Cargo Traffic (tons)<br />
Year PHI<br />
Low<br />
LEGASPI<br />
Medium High<br />
2005 840,390 870 1,030 1,210<br />
2010 1,182,300 1,230 1,440 1,700<br />
2015 1,609,190 1,670 1,970 2,310<br />
2020 2,163,150 2,250 2,640 3,110<br />
2025 2,882,020 2,990 3,520 4,150<br />
3.4 PEAK-HOUR AIR TRAFFIC VOLUMES<br />
The design of airport facilities is normally based on the volume occurring during the<br />
peak-hour on an average day of the peak month. Adjustment factors are derived to<br />
translate the forecasted two-way annual air traffic into the design hourly volume.<br />
Using data provided by ATO-<strong>Legaspi</strong> for the last two years (2000-2001), the peak<br />
month was determined to be consistently occurring during the month of May. The<br />
3-6