

Unemployment cycles
WP201526
WP201526

You also want an ePaper? Increase the reach of your titles
YUMPU automatically turns print PDFs into web optimized ePapers that Google loves.
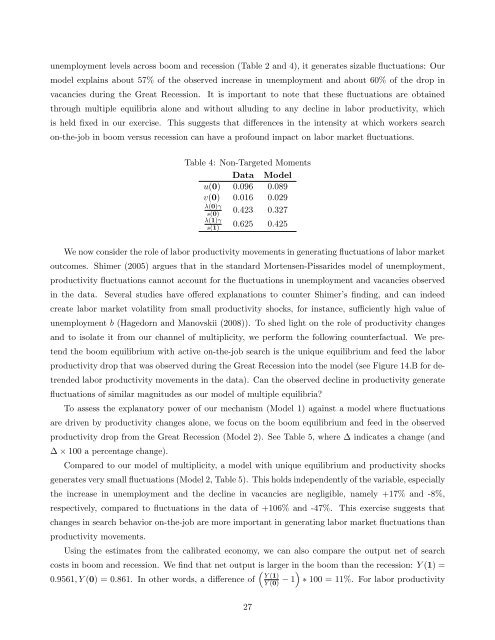
unemployment levels across boom and recession (Table 2 and 4), it generates sizable fluctuations: Our<br />
model explains about 57% of the observed increase in unemployment and about 60% of the drop in<br />
vacancies during the Great Recession. It is important to note that these fluctuations are obtained<br />
through multiple equilibria alone and without alluding to any decline in labor productivity, which<br />
is held fixed in our exercise. This suggests that differences in the intensity at which workers search<br />
on-the-job in boom versus recession can have a profound impact on labor market fluctuations.<br />
Table 4: Non-Targeted Moments<br />
Data Model<br />
u(0) 0.096 0.089<br />
v(0) 0.016 0.029<br />
λ(0)γ<br />
s(0)<br />
0.423 0.327<br />
λ(1)γ<br />
s(1)<br />
0.625 0.425<br />
We now consider the role of labor productivity movements in generating fluctuations of labor market<br />
outcomes. Shimer (2005) argues that in the standard Mortensen-Pissarides model of unemployment,<br />
productivity fluctuations cannot account for the fluctuations in unemployment and vacancies observed<br />
in the data.<br />
Several studies have offered explanations to counter Shimer’s finding, and can indeed<br />
create labor market volatility from small productivity shocks, for instance, sufficiently high value of<br />
unemployment b (Hagedorn and Manovskii (2008)). To shed light on the role of productivity changes<br />
and to isolate it from our channel of multiplicity, we perform the following counterfactual. We pretend<br />
the boom equilibrium with active on-the-job search is the unique equilibrium and feed the labor<br />
productivity drop that was observed during the Great Recession into the model (see Figure 14.B for detrended<br />
labor productivity movements in the data). Can the observed decline in productivity generate<br />
fluctuations of similar magnitudes as our model of multiple equilibria?<br />
To assess the explanatory power of our mechanism (Model 1) against a model where fluctuations<br />
are driven by productivity changes alone, we focus on the boom equilibrium and feed in the observed<br />
productivity drop from the Great Recession (Model 2). See Table 5, where ∆ indicates a change (and<br />
∆ × 100 a percentage change).<br />
Compared to our model of multiplicity, a model with unique equilibrium and productivity shocks<br />
generates very small fluctuations (Model 2, Table 5). This holds independently of the variable, especially<br />
the increase in unemployment and the decline in vacancies are negligible, namely +17% and -8%,<br />
respectively, compared to fluctuations in the data of +106% and -47%. This exercise suggests that<br />
changes in search behavior on-the-job are more important in generating labor market fluctuations than<br />
productivity movements.<br />
Using the estimates from the calibrated economy, we can also compare the output net of search<br />
costs in boom and recession. We find that net output is larger in the boom than the recession: Y (1) =<br />
( )<br />
0.9561, Y (0) = 0.861. In other words, a difference of Y (1)<br />
Y (0) − 1 ∗ 100 = 11%. For labor productivity<br />
27