Fast 3D thick mask model for full-chip EUVL simulations
Fast 3D thick mask model for full-chip EUVL simulations - Brion ...
Fast 3D thick mask model for full-chip EUVL simulations - Brion ...
- No tags were found...

You also want an ePaper? Increase the reach of your titles
YUMPU automatically turns print PDFs into web optimized ePapers that Google loves.
I<br />
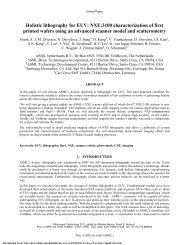
Dark field thru -pitch thru -focus pattern shift of<br />
12nm space at slit edge<br />
2.5<br />
2<br />
E 15<br />
c<br />
t 0.5<br />
tn c 0<br />
-X Shift -FDTD<br />
o X Shift -M<strong>3D</strong>+<br />
-V Shift -FDTD<br />
o V_Shift -M<strong>3D</strong>+<br />
-2<br />
0 80-4040 -d0 0 80-4040 -do 0 80-4040 -80 0 80-4040 -80 0 80-4040 -d0 0 80-4040<br />
30 32 34 36 38 40 50 60 70 80 90 100<br />
F Focus (nm)<br />
F Pitch (nm)<br />
Figure 12(c): Dark field thru-pitch thru-focus pattern shift of 12nm space at slit edge under the nominal dose condition<br />
4.2 2D pattern case study<br />
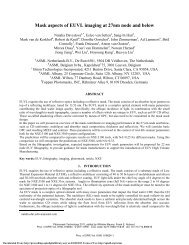
2D patterns of an actual design are much more diverse compared to 1D patterns. To make this study more relevant, we<br />
adopted the 2D patterns previously investigated by a device manufacturer, which highlighted the need of <strong>3D</strong> <strong>mask</strong><br />
<strong>model</strong>ing in EUV applications 11 . These patterns are shown in Figure 13.<br />
EX1 (anchor)<br />
00<br />
D °° D<br />
CC<br />
0 0<br />
0 0 0 0<br />
0 0<br />
0 0<br />
° ° ° °<br />
° ' °<br />
0 0 00 0<br />
O° 0 0 0 0 0<br />
DC DO 0<br />
x 14nm<br />
0$ 22nm o 0 0<br />
0 0 0 0<br />
0 0 0<br />
0 0<br />
0 0<br />
° ° °<br />
EX2oo<br />
o 0 0<br />
0 0 2 nm x 14n<br />
0 0 0 0 0<br />
0 0 0<br />
0 0 0 0 0<br />
CC 0<br />
00 0<br />
° ° ° °<br />
EX4A<br />
EX16<br />
0 0<br />
0 0<br />
D O C C<br />
0 0<br />
Do<br />
13nmx26n,<br />
] 0-9-0 0<br />
0 0 0 0<br />
1 0 0 0 0<br />
Figure 13: 2D patterns used in simulation<br />
l0000000<br />
0 0 0 0 0<br />
22nm x 14nm<br />
0-12- o 0 0<br />
O C C<br />
0 0<br />
O C O O<br />
0 0 0<br />
The size of the feature at the simulation domain center is labeled. In this work these patterns were directly used in<br />
<strong>simulations</strong> without any OPC. Again, rigorous <strong>simulations</strong> were done first to generate reference data. The X- and Y-<br />
CD’s of the first pattern (EX1) at the slit center under the nominal FEM condition were used to calibrate the M<strong>3D</strong>+<br />
<strong>model</strong> and the thin <strong>mask</strong> <strong>model</strong>. Only threshold was calibrated <strong>for</strong> the M<strong>3D</strong>+ <strong>model</strong>. For the thin <strong>mask</strong> <strong>model</strong>, HV bias<br />
was also calibrated in addition to threshold. Then the calibrated <strong>model</strong> was used to predict the printed contours of all<br />
patterns and compared to rigorous results. The RMS of predicted CD delta to FDTD is shown in Figure 14.<br />
Proc. of SPIE Vol. 8679 86790W-12<br />
Downloaded From: http://spiedigitallibrary.org/ on 05/06/2013 Terms of Use: http://spiedl.org/terms