Fast 3D thick mask model for full-chip EUVL simulations
Fast 3D thick mask model for full-chip EUVL simulations - Brion ...
Fast 3D thick mask model for full-chip EUVL simulations - Brion ...
- No tags were found...

You also want an ePaper? Increase the reach of your titles
YUMPU automatically turns print PDFs into web optimized ePapers that Google loves.
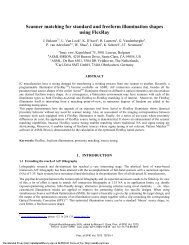
epresentative enough <strong>for</strong> the entire source. This turns out to be an acceptable assumption from CD and best focus<br />
prediction point of view. But it may not be adequate <strong>for</strong> pattern shift prediction depending on the accuracy requirement.<br />
DUV<br />
(Øuv<br />
-20°<br />
Figure 3: Comparison of the range of incident angle distribution on <strong>mask</strong> between EUV and DUV<br />
A straight<strong>for</strong>ward method to <strong>model</strong> the incident angle effect of a partially coherent illumination is to decompose the<br />
illumination pupil shape into smaller sections 9 . The angle of incidence is considered constant within each section and<br />
there<strong>for</strong>e only one rigorous <strong>3D</strong> <strong>mask</strong> simulation is required to compute its contribution to the wafer image using<br />
Hopkins approach. The total wafer image is the sum of the images produced by individual sections. The result is<br />
expected to converge as the number of sections increases.<br />
A simulation work was carried out to study the convergence as a function of the number of incident angles used <strong>for</strong><br />
rigorous EUV <strong>mask</strong> <strong>simulations</strong>. The illumination pupil shape and the incident angle locations are shown in Figure 4(a).<br />
The pupil shape is the same as that shown in Figure 2 and is used to illuminate the <strong>mask</strong> at the slit edge.<br />
r1 r1 r r:<br />
Figure 4(a): Pupil shape and incident angle locations used <strong>for</strong> rigorous <strong>3D</strong> <strong>mask</strong> <strong>simulations</strong><br />
We investigated both bright-field and dark-field <strong>mask</strong>s having horizontal (H) and vertical (V) lines or spaces of<br />
width=12nm and pitch=100nm on wafer scale. The simulation was done using HyperLith’s RCWA-based rigorous <strong>3D</strong><br />
<strong>mask</strong> <strong>model</strong>. We pre-scanned the <strong>mask</strong> defocus and selected a value to minimize the global patterns shift. This value was<br />
then fixed <strong>for</strong> all the <strong>simulations</strong>. Figure 4(b) shows the results of Bossung curves of XCD (CD of V line/space) and<br />
YCD (CD of H line/space). It is apparent that the number of angles has very small effect on CD and best focus shift. One<br />
angle of incidence at the chief ray may be considered adequate. It is also worth noting that the best focus shift is patterndependent<br />
between horizontal and vertical features, caused by <strong>3D</strong> <strong>mask</strong> topographies.<br />
Bright Field X & Y Bossung<br />
-100 -80 -60 -40 -20 0 20 40<br />
Wager Faune, nm<br />
60 80 100<br />
zcD_Mngles=l<br />
-XCD_Mngles=2<br />
-XCO_nAngles=4<br />
-XCD_nangles=12<br />
- XCD nAngles=l6<br />
-Y,11D_ A gl -<br />
-YCO_nAngles=2<br />
-0C11_44n0es=4<br />
- YCD Mngles=l2<br />
-YCD_Mngles=l6<br />
Dark Field X & Y Bossung<br />
-100 -80 -60 -40 -20 0 20 40 60<br />
Miler Foam, M<br />
80 100<br />
-XCO Mngles=l<br />
X00_44444=2<br />
XC0_nAngles=4<br />
XCD_nAndes=12<br />
-XCD_nAn41es=16<br />
-YCD_Mngles=l<br />
-1CD_Mngles=2<br />
-YCD_Mngles=4<br />
-VCD_Mngles=l2<br />
-YCD_Mngles=16<br />
Figure 4(b): Convergence of Bossung curve as a function of the number of incident angles used <strong>for</strong> rigorous <strong>3D</strong><br />
<strong>mask</strong> <strong>simulations</strong>. XCD = CD of V line/space. YCD = CD of H line/space.<br />
Proc. of SPIE Vol. 8679 86790W-4<br />
Downloaded From: http://spiedigitallibrary.org/ on 05/06/2013 Terms of Use: http://spiedl.org/terms