REPORT 2013
Half Year Report 2013 - Fiji Revenue & Customs Authority
Half Year Report 2013 - Fiji Revenue & Customs Authority
- No tags were found...

Create successful ePaper yourself
Turn your PDF publications into a flip-book with our unique Google optimized e-Paper software.
7<br />
Critical Success Factor: Financial<br />
• Fiscally responsible management.<br />
• Strengthen risk management.<br />
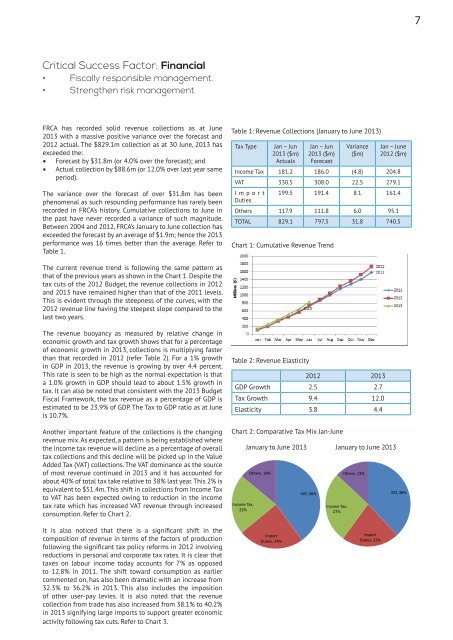
FRCA has recorded solid revenue collections as at June<br />
<strong>2013</strong> with a massive positive variance over the forecast and<br />
2012 actual. The $829.1m collection as at 30 June, <strong>2013</strong> has<br />
exceeded the:<br />
• Forecast by $31.8m (or 4.0% over the forecast); and<br />
• Actual collection by $88.6m (or 12.0% over last year same<br />
period).<br />
The variance over the forecast of over $31.8m has been<br />
phenomenal as such resounding performance has rarely been<br />
recorded in FRCA’s history. Cumulative collections to June in<br />
the past have never recorded a variance of such magnitude.<br />
Between 2004 and 2012, FRCA’s January to June collection has<br />
exceeded the forecast by an average of $1.9m; hence the <strong>2013</strong><br />
performance was 16 times better than the average. Refer to<br />
Table 1.<br />
Table 1: Revenue Collections (January to June <strong>2013</strong>)<br />
Tax Type<br />
Jan – Jun<br />
<strong>2013</strong> ($m)<br />
Actuals<br />
Jan – Jun<br />
<strong>2013</strong> ($m)<br />
Forecast<br />
Variance<br />
($m)<br />
Jan – June<br />
2012 ($m)<br />
Income Tax 181.2 186.0 (4.8) 204.8<br />
VAT 330.5 308.0 22.5 279.1<br />
Import<br />
Duties<br />
199.5 191.4 8.1 161.4<br />
Others 117.9 111.8 6.0 95.1<br />
TOTAL 829.1 797.3 31.8 740.5<br />
Chart 1: Cumulative Revenue Trend<br />
The current revenue trend is following the same pattern as<br />
that of the previous years as shown in the Chart 1. Despite the<br />
tax cuts of the 2012 Budget, the revenue collections in 2012<br />
and <strong>2013</strong> have remained higher than that of the 2011 levels.<br />
This is evident through the steepness of the curves, with the<br />
2012 revenue line having the steepest slope compared to the<br />
last two years.<br />
The revenue buoyancy as measured by relative change in<br />
economic growth and tax growth shows that for a percentage<br />
of economic growth in <strong>2013</strong>, collections is multiplying faster<br />
than that recorded in 2012 (refer Table 2). For a 1% growth<br />
in GDP in <strong>2013</strong>, the revenue is growing by over 4.4 percent.<br />
This rate is seen to be high as the normal expectation is that<br />
a 1.0% growth in GDP should lead to about 1.5% growth in<br />
tax. It can also be noted that consistent with the <strong>2013</strong> Budget<br />
Fiscal Framework, the tax revenue as a percentage of GDP is<br />
estimated to be 23.9% of GDP. The Tax to GDP ratio as at June<br />
is 10.7%.<br />
Another important feature of the collections is the changing<br />
revenue mix. As expected, a pattern is being established where<br />
the income tax revenue will decline as a percentage of overall<br />
tax collections and this decline will be picked up in the Value<br />
Added Tax (VAT) collections. The VAT dominance as the source<br />
of most revenue continued in <strong>2013</strong> and it has accounted for<br />
about 40% of total tax take relative to 38% last year. This 2% is<br />
equivalent to $51.4m. This shift in collections from Income Tax<br />
to VAT has been expected owing to reduction in the income<br />
tax rate which has increased VAT revenue through increased<br />
consumption. Refer to Chart 2.<br />
Table 2: Revenue Elasticity<br />
2012 <strong>2013</strong><br />
GDP Growth 2.5 2.7<br />
Tax Growth 9.4 12.0<br />
Elasticity 3.8 4.4<br />
Chart 2: Comparative Tax Mix Jan-June<br />
Income Tax,<br />
22%<br />
January to June <strong>2013</strong> January to June <strong>2013</strong><br />
Others, 14%<br />
VAT, 40%<br />
Income Tax,<br />
27%<br />
Others, 13%<br />
VAT, 38%<br />
It is also noticed that there is a significant shift in the<br />
composition of revenue in terms of the factors of production<br />
following the significant tax policy reforms in 2012 involving<br />
reductions in personal and corporate tax rates. It is clear that<br />
taxes on labour income today accounts for 7% as opposed<br />
to 12.8% in 2011. The shift toward consumption as earlier<br />
commented on, has also been dramatic with an increase from<br />
32.3% to 36.2% in <strong>2013</strong>. This also includes the imposition<br />
of other user-pay levies. It is also noted that the revenue<br />
collection from trade has also increased from 38.1% to 40.2%<br />
in <strong>2013</strong> signifying large imports to support greater economic<br />
activity following tax cuts. Refer to Chart 3.<br />
Import<br />
Duties, 24%<br />
Import<br />
Duties, 22%