- Page 1 and 2:
Tungsten Replicator 2.2 Manual Cont
- Page 3 and 4:
iii Table of Contents Preface . . .
- Page 5 and 6:
Tungsten Replicator 2.2 Manual v 4.
- Page 7 and 8:
Tungsten Replicator 2.2 Manual vii
- Page 9 and 10:
Tungsten Replicator 2.2 Manual ix D
- Page 11 and 12:
List of Figures 2.1. Topologies: Co
- Page 13 and 14:
Preface This manual documents Tungs
- Page 15 and 16:
Chapter 1. Introduction Tungsten Re
- Page 17 and 18:
Introduction 1.1.4. Filtering For m
- Page 19 and 20:
Deployment Source/Destination MySQL
- Page 21 and 22:
Deployment • Deployment of a live
- Page 23 and 24:
Deployment 8. Run tpm install if th
- Page 25 and 26:
Deployment Starts the service once
- Page 27 and 28:
Deployment Figure 2.3, “Topologie
- Page 29 and 30:
Deployment Specifies the list of se
- Page 31 and 32:
Deployment minimumStoredSeqNo : 0 o
- Page 33 and 34:
Deployment • tpm install Executes
- Page 35 and 36:
Deployment • host1 is the master
- Page 37 and 38:
Deployment role : master serviceNam
- Page 39 and 40:
Deployment masterConnectUri : thl:/
- Page 41 and 42:
Deployment Figure 2.6. Topologies:
- Page 43 and 44:
Deployment rmiPort : 10000 role : m
- Page 45 and 46:
Deployment 3. Run the ./tools/updat
- Page 47 and 48:
Deployment To perform an upgrade of
- Page 49 and 50:
Deployment shell> cd tungsten-repli
- Page 51 and 52:
Heterogenous Deployments • For My
- Page 53 and 54:
Heterogenous Deployments For config
- Page 55 and 56:
Heterogenous Deployments Figure 3.6
- Page 57 and 58:
Heterogenous Deployments For more i
- Page 59 and 60:
Heterogenous Deployments The user n
- Page 61 and 62:
Heterogenous Deployments 4. Install
- Page 63 and 64:
Heterogenous Deployments Dropping v
- Page 65 and 66:
Heterogenous Deployments • --repl
- Page 67 and 68:
Heterogenous Deployments Skip valid
- Page 69 and 70:
Heterogenous Deployments Then resta
- Page 71 and 72:
Heterogenous Deployments SQL> GRANT
- Page 73 and 74: Heterogenous Deployments • --repl
- Page 75 and 76: Heterogenous Deployments 3.2.6. Dep
- Page 77 and 78: Heterogenous Deployments 3.2.9. Tun
- Page 79 and 80: Heterogenous Deployments title: Cre
- Page 81 and 82: Heterogenous Deployments shell> tre
- Page 83 and 84: Heterogenous Deployments The db.col
- Page 85 and 86: Heterogenous Deployments Directory
- Page 87 and 88: Heterogenous Deployments appliedLat
- Page 89 and 90: Heterogenous Deployments Alternativ
- Page 91 and 92: Heterogenous Deployments Disable th
- Page 93 and 94: Heterogenous Deployments channels :
- Page 95 and 96: Chapter 4. Advanced Deployments 4.1
- Page 97 and 98: Advanced Deployments 1. Stop replic
- Page 99 and 100: Advanced Deployments 4.2.3. Channel
- Page 101 and 102: Advanced Deployments This command b
- Page 103 and 104: Advanced Deployments 4.2.7.5. Maxim
- Page 105 and 106: Advanced Deployments You can update
- Page 107 and 108: Advanced Deployments • --svc-extr
- Page 109 and 110: Advanced Deployments Note also that
- Page 111 and 112: Advanced Deployments 1. Install mas
- Page 113 and 114: Advanced Deployments The process is
- Page 115 and 116: Advanced Deployments Now export the
- Page 117 and 118: Advanced Deployments To configure t
- Page 119 and 120: Advanced Deployments The password f
- Page 121 and 122: Advanced Deployments cctrl> switch
- Page 123: Advanced Deployments The connection
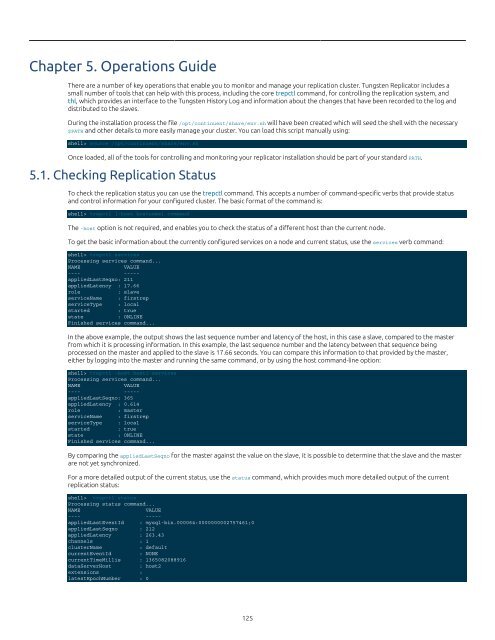
- Page 127 and 128: Operations Guide • relativeLatenc
- Page 129 and 130: Operations Guide shell> trepctl sta
- Page 131 and 132: Operations Guide A modified table s
- Page 133 and 134: Operations Guide autoRecoveryEnable
- Page 135 and 136: Operations Guide Using mysqldump ca
- Page 137 and 138: Operations Guide For example, on th
- Page 139 and 140: Operations Guide role : slave state
- Page 141 and 142: Operations Guide 2. Perform the req
- Page 143 and 144: Operations Guide definition will be
- Page 145 and 146: Command-line Tools Note To check th
- Page 147 and 148: Command-line Tools planet CHAR, val
- Page 149 and 150: Command-line Tools MySQL Datatype O
- Page 151 and 152: Command-line Tools • BLOB types i
- Page 153 and 154: Command-line Tools shell> multi_tre
- Page 155 and 156: Command-line Tools | tr-ms1 | alpha
- Page 157 and 158: Command-line Tools Config File Opti
- Page 159 and 160: Command-line Tools Description Valu
- Page 161 and 162: Command-line Tools 2047 1412 1 true
- Page 163 and 164: Command-line Tools 6.7.4. thl info
- Page 165 and 166: Command-line Tools Figure 6.2. tpm
- Page 167 and 168: Command-line Tools This is done to
- Page 169 and 170: Command-line Tools All hosts includ
- Page 171 and 172: Command-line Tools 6.8.4.4. Configu
- Page 173 and 174: Command-line Tools The username to
- Page 175 and 176:
Command-line Tools "staging_directo
- Page 177 and 178:
Command-line Tools The tpm start ca
- Page 179 and 180:
Command-line Tools CmdLine Option I
- Page 181 and 182:
Command-line Tools CmdLine Option I
- Page 183 and 184:
Command-line Tools CmdLine Option I
- Page 185 and 186:
Command-line Tools CmdLine Option I
- Page 187 and 188:
Command-line Tools Config File Opti
- Page 189 and 190:
Command-line Tools Option --composi
- Page 191 and 192:
Command-line Tools Aliases --repl-d
- Page 193 and 194:
Command-line Tools Option --direct-
- Page 195 and 196:
Command-line Tools • enumtostring
- Page 197 and 198:
Command-line Tools --hub-service Op
- Page 199 and 200:
Command-line Tools Config File Opti
- Page 201 and 202:
Command-line Tools --mysql-xtraback
- Page 203 and 204:
Command-line Tools Value Type strin
- Page 205 and 206:
Command-line Tools -rw-r----- 1 tun
- Page 207 and 208:
Command-line Tools Value Type strin
- Page 209 and 210:
Command-line Tools Value Type numer
- Page 211 and 212:
Command-line Tools --thl-do-checksu
- Page 213 and 214:
Command-line Tools • Getting stat
- Page 215 and 216:
Command-line Tools trepctl services
- Page 217 and 218:
Command-line Tools The individualit
- Page 219 and 220:
Command-line Tools • Flush Indica
- Page 221 and 222:
Command-line Tools Heartbeats are g
- Page 223 and 224:
Command-line Tools Because there is
- Page 225 and 226:
Command-line Tools If the replicato
- Page 227 and 228:
Command-line Tools shell> trepctl p
- Page 229 and 230:
Command-line Tools shell> trepctl s
- Page 231 and 232:
Command-line Tools ---- ----- appli
- Page 233 and 234:
Command-line Tools lastCommittedBlo
- Page 235 and 236:
Command-line Tools ] "storeClass" :
- Page 237 and 238:
Command-line Tools If the requested
- Page 239 and 240:
Command-line Tools The tungsten_set
- Page 241 and 242:
Chapter 7. Using the Cookbook 241
- Page 243 and 244:
Replication Filters Figure 8.2. Fil
- Page 245 and 246:
Replication Filters The first line
- Page 247 and 248:
Replication Filters Filter Type Des
- Page 249 and 250:
Replication Filters tableNameSuffix
- Page 251 and 252:
Replication Filters to_regex3 strin
- Page 253 and 254:
Replication Filters heartbeatInterv
- Page 255 and 256:
Replication Filters } 8.4.15.2. Net
- Page 257 and 258:
Replication Filters The length, in
- Page 259 and 260:
Replication Filters None The filter
- Page 261 and 262:
Replication Filters tpm Option comp
- Page 263 and 264:
Replication Filters The area is bei
- Page 265 and 266:
Replication Filters The SetToString
- Page 267 and 268:
Replication Filters Making a backup
- Page 269 and 270:
Replication Filters • logger.erro
- Page 271 and 272:
Replication Filters d instanceof co
- Page 273 and 274:
Replication Filters Extracting Colu
- Page 275 and 276:
Replication Filters This changes a
- Page 277 and 278:
Replication Filters { sourceName =
- Page 279 and 280:
Replication Filters ] { "schema": "
- Page 281 and 282:
Replication Filters d = data.get(i)
- Page 283 and 284:
Replication Filters } sqlNew = sqlO
- Page 285 and 286:
Replication Filters JavaScript Filt
- Page 287 and 288:
Chapter 9. Performance and Tuning T
- Page 289 and 290:
Performance and Tuning # Decrease t
- Page 291 and 292:
Appendix A. Troubleshooting The fol
- Page 293 and 294:
Troubleshooting Rectifications •
- Page 295 and 296:
Troubleshooting INFO | jvm 1 | 2013
- Page 297 and 298:
Appendix B. Release Notes B.1. Tung
- Page 299 and 300:
Release Notes Issues: 794 • Unsig
- Page 301 and 302:
Release Notes • The ddlscan tool
- Page 303 and 304:
Release Notes • An UnsupportedEnc
- Page 305 and 306:
Prerequisites shell> sudo usermod -
- Page 307 and 308:
Prerequisites • The IP address of
- Page 309 and 310:
Prerequisites Important It is recom
- Page 311 and 312:
Prerequisites • A value of 0 (zer
- Page 313 and 314:
Prerequisites Environment Variable
- Page 315 and 316:
Terminology Reference - OPTIONS = [
- Page 317 and 318:
Terminology Reference Part of the E
- Page 319 and 320:
Terminology Reference D.2.13. Termi
- Page 321 and 322:
Terminology Reference D.2.47. Termi
- Page 323 and 324:
Terminology Reference D.2.74. Termi
- Page 325 and 326:
Appendix E. Files, Directories, and
- Page 327 and 328:
Files, Directories, and Environment
- Page 329 and 330:
Files, Directories, and Environment
- Page 331 and 332:
Files, Directories, and Environment
- Page 333 and 334:
Appendix F. Internals Tungsten Repl
- Page 335 and 336:
Internals # Write the filename to t
- Page 337 and 338:
Internals they do not ever become e
- Page 339 and 340:
Frequently Asked Questions (FAQ) As
- Page 341 and 342:
Ecosystem Support 7. Add the desire


