The Ahikuntaka
A publication documenting the lives and livelihoods of the Ahikuntaka or gypsy community in Sri Lanka. A collection of vibrant photographs and a baseline survey on the current socio economic status of the Ahikuntaka conducted by the Colombo University complement this timely publication.
A publication documenting the lives and livelihoods of the Ahikuntaka or gypsy community in Sri Lanka. A collection of vibrant photographs and a baseline survey on the current socio economic status of the Ahikuntaka conducted by the Colombo University complement this timely publication.

Create successful ePaper yourself
Turn your PDF publications into a flip-book with our unique Google optimized e-Paper software.
www.dilmahconservation.org<br />
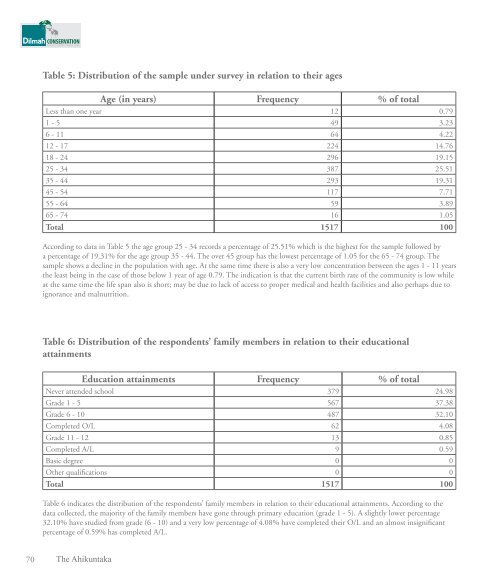
Table 5: Distribution of the sample under survey in relation to their ages<br />
Age (in years) Frequency % of total<br />
Less than one year 12 0.79<br />
1 - 5 49 3.23<br />
6 - 11 64 4.22<br />
12 - 17 224 14.76<br />
18 - 24 296 19.15<br />
25 - 34 387 25.51<br />
35 - 44 293 19.31<br />
45 - 54 117 7.71<br />
55 - 64 59 3.89<br />
65 - 74 16 1.05<br />
Total 1517 100<br />
According to data in Table 5 the age group 25 - 34 records a percentage of 25.51% which is the highest for the sample followed by<br />
a percentage of 19.31% for the age group 35 - 44. <strong>The</strong> over 45 group has the lowest percentage of 1.05 for the 65 - 74 group. <strong>The</strong><br />
sample shows a decline in the population with age. At the same time there is also a very low concentration between the ages 1 - 11 years<br />
the least being in the case of those below 1 year of age 0.79. <strong>The</strong> indication is that the current birth rate of the community is low while<br />
at the same time the life span also is short; may be due to lack of access to proper medical and health facilities and also perhaps due to<br />
ignorance and malnutrition.<br />
Table 6: Distribution of the respondents’ family members in relation to their educational<br />
attainments<br />
Education attainments Frequency % of total<br />
Never attended school 379 24.98<br />
Grade 1 - 5 567 37.38<br />
Grade 6 - 10 487 32.10<br />
Completed O/L 62 4.08<br />
Grade 11 - 12 13 0.85<br />
Completed A/L 9 0.59<br />
Basic degree 0 0<br />
Other qualifications 0 0<br />
Total 1517 100<br />
Table 6 indicates the distribution of the respondents’ family members in relation to their educational attainments. According to the<br />
data collected, the majority of the family members have gone through primary education (grade 1 - 5). A slightly lower percentage<br />
32.10% have studied from grade (6 - 10) and a very low percentage of 4.08% have completed their O/L and an almost insignificant<br />
percentage of 0.59% has completed A/L.<br />
70 <strong>The</strong> <strong>Ahikuntaka</strong>