

sell sell
1OyFFgu
1OyFFgu

Create successful ePaper yourself
Turn your PDF publications into a flip-book with our unique Google optimized e-Paper software.
tech<br />
follow The<br />
North Star<br />
Chad Pytel,<br />
Founder and CEO of<br />
Thoughtbot.co.uk<br />
If you’re getting<br />
a constant<br />
number of new<br />
customers every<br />
month, you’re in<br />
trouble, because<br />
that means your<br />
growth rate is<br />
decreasing.<br />
It is difficult to prioritise between product and<br />
growth. Should we write a new feature or remove<br />
one? Fix that bug, improve the UI, or optimise<br />
our funnel? Maybe write a blog post for a lead<br />
nurturing campaign?<br />
The North Star has been used for navigation since<br />
Late Antiquity. And using it as a metaphor, we can<br />
guide startups by answering a simple question:<br />
How many people are getting authentic value from<br />
our product? Authentic value. We’re not measuring<br />
vanity metrics such as page views, sessions,<br />
followers, or users. The moment when a user gets<br />
authentic value.<br />
Example North Star metric<br />
Thoughtbot’s mission is to create better products.<br />
We believe keeping code in a consistent style helps<br />
create better products.<br />
Our product Hound (houndci.com) does that job by<br />
reviewing GitHub pull requests for style violations.<br />
The moment Hound reviews code is called a<br />
“build.” That is the moment a user gets authentic<br />
value. It is the moment the product’s job is done.<br />
So Hound’s North Star metric is the number of<br />
teams with builds.<br />
How to calculate it<br />
We’ve often calculated the North Star metric using<br />
our application’s SQL database. In the case of<br />
Hound, aggregating our ‘build’ data into weeks<br />
and restricting the time window to the previous<br />
quarter, including the week in progress.<br />
Paul Graham has written that Y Combinator<br />
startups should grow by 7% per week:<br />
“When I first meet founders and ask what their<br />
growth rate is, sometimes they tell me “we get<br />
about a hundred new customers a month.” That’s<br />
not a rate. What matters is not the absolute number<br />
of new customers, but the ratio of new customers<br />
to existing ones. If you’re really getting a constant<br />
number of new customers every month, you’re in<br />
trouble, because that means your growth rate is<br />
decreasing.”<br />
It’s necessary to calculate both absolute numbers,<br />
and growth rate to understand the product’s health.<br />
We want to know Hound that currently has “266<br />
teams with builds per week”, and is growing at<br />
“9% per week” (the average of the trailing quarter,<br />
excluding the current week).<br />
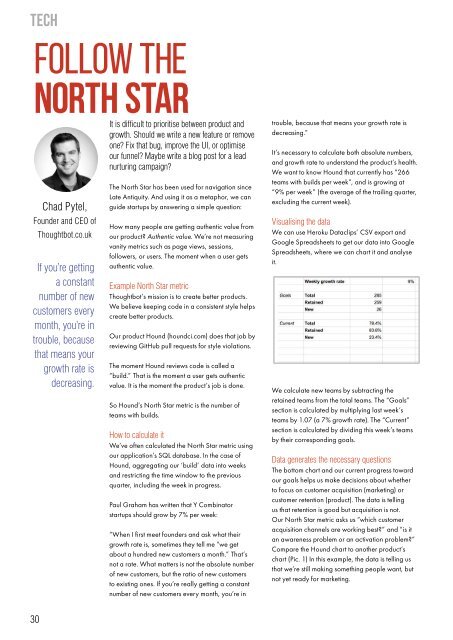
Visualising the data<br />
We can use Heroku Dataclips’ CSV export and<br />
Google Spreadsheets to get our data into Google<br />
Spreadsheets, where we can chart it and analyse<br />
it.<br />
We calculate new teams by subtracting the<br />
retained teams from the total teams. The “Goals”<br />
section is calculated by multiplying last week’s<br />
teams by 1.07 (a 7% growth rate). The “Current”<br />
section is calculated by dividing this week’s teams<br />
by their corresponding goals.<br />
Data generates the necessary questions<br />
The bottom chart and our current progress toward<br />
our goals helps us make decisions about whether<br />
to focus on customer acquisition (marketing) or<br />
customer retention (product). The data is telling<br />
us that retention is good but acquisition is not.<br />
Our North Star metric asks us “which customer<br />
acquisition channels are working best?” and “is it<br />
an awareness problem or an activation problem?”<br />
Compare the Hound chart to another product’s<br />
chart (Pic. 1) In this example, the data is telling us<br />
that we’re still making something people want, but<br />
not yet ready for marketing.<br />
30