

TRAFFICKING IN PERSONS
397604438Trafficking_in_Persons_National_Report_2013-15
397604438Trafficking_in_Persons_National_Report_2013-15

You also want an ePaper? Increase the reach of your titles
YUMPU automatically turns print PDFs into web optimized ePapers that Google loves.
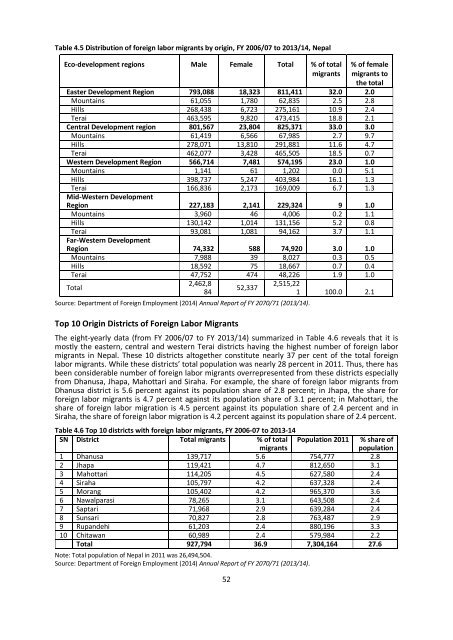
Table 4.7 shows both annual flow and stock of foreign labor migrants by country of destination. The<br />
flow of foreign labor migrants was more than 500 thousands in FY 2014/15 with an overwhelming<br />
majority of males. The stock of migrants in between 2006/07 and 2014/15 has been calculated as 3<br />
million having 2.95 million males and 75,000 females. In terms of flow or stock of migrants, four<br />
countries stand out to be prominent: Malaysia (39%),Qatar (23.5%), Saudi Arabia (20%) and UAE<br />
(11%).<br />
4.3 Skills of Foreign Labor Migrants<br />
Skill of the workers is highly associated with their wages/salary and security. Generally, it is the<br />
unskilled workers who have lowest wages/salary and they are also at risk of exploitation and<br />
trafficking. Nearly three in four Nepali foreign labor migrants are unskilled workers while another 12<br />
percent are semi-skilled workers and there are only 14 percent of the total foreign labor migrants<br />
who are skilled workers. This pattern almost holds for the FY 2014/15 as well (Table 4.8).<br />
Table 4.8 Number of foreign labor migrants in FY 2013/14, Nepal<br />
2013/14 2014/15<br />
Male Female Total Male Female Total<br />
Skilled 14.4 11.6 14.3 13.7 9.1 13.5<br />
Unskilled 73.6 74.7 73.7 74.4 77.3 74.5<br />
Semi-skilled 11.9 13.5 12.0 11.9 13.4 12.0<br />
Professional 0.0 0.3 0.0 0.0 0.1 0.0<br />
High skills 0.0 0.0 0.0 0.0 0.0 0.0<br />
Total 100.0 100.0 100.0 100.0 100.0 100.0<br />
Number of foreign labor<br />
448,733<br />
migrants 434,716 14,992 449,708 432,080 16,653<br />
Source: Department of Foreign Employment (2014) Annual Report of FY 2070/71 (2013/14) and Annual Report of FY<br />
2071/72 (2014/15) (Unpublished). Note the figure for total outflow of migrants is 512,887 in FY 2014/15 but information<br />
about skills is available only for 448,733 migrant workers..<br />
4.4 Remittances<br />
Several studies suggest considerable development implications of migration for the origin as well as<br />
in destination countries (Ratha and et al., 2012). The main channels through which migration<br />
alleviates poverty and improves development outcomes are: increased incomes from remittances;<br />
improved health care, education and nutrition; ability to smooth consumption (saving for retirement<br />
life); and better access to finance for both recipient households and for countries. In Nepal,<br />
remittance income has become one of the major sources of income at the national economy (Table<br />
4.9). It contributes to 29 percent of the total Gross Domestic Product (GDP) of Nepal and it is much<br />
higher than that of other two major foreign earning sectors such as tourism (2.3% of GDP) and<br />
foreign loan and grants (5.9% of GDP).<br />
54