Research Institute
ekthsi_0
ekthsi_0

You also want an ePaper? Increase the reach of your titles
YUMPU automatically turns print PDFs into web optimized ePapers that Google loves.
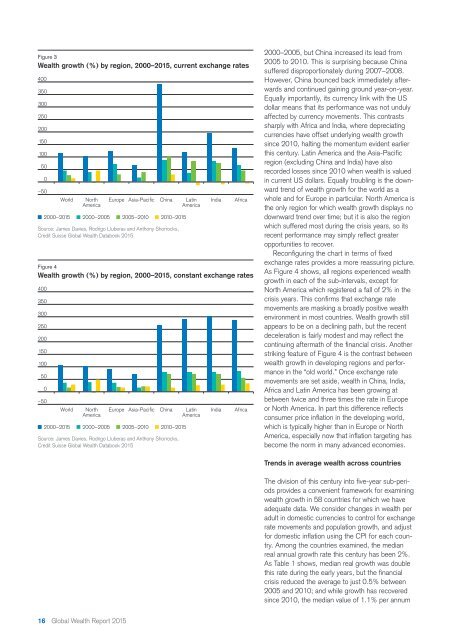
Figure 3<br />
Wealth growth (%) by region, 2000–2015, current exchange rates<br />
400<br />
350<br />
300<br />
250<br />
200<br />
150<br />
100<br />
50<br />
0<br />
–50<br />
World North Europe Asia-Pacific China Latin<br />
America<br />
America<br />
Source: James Davies, Rodrigo Lluberas and Anthony Shorrocks,<br />
Credit Suisse Global Wealth Databook 2015<br />
Figure 4<br />
Wealth growth (%) by region, 2000–2015, constant exchange rates<br />
400<br />
350<br />
300<br />
250<br />
200<br />
150<br />
100<br />
50<br />
2000–2015 2000–2005 2005–2010 2010–2015<br />
0<br />
–50<br />
World North Europe Asia-Pacific China Latin<br />
America<br />
America<br />
2000–2015 2000–2005 2005–2010 2010–2015<br />
Source: James Davies, Rodrigo Lluberas and Anthony Shorrocks,<br />
Credit Suisse Global Wealth Databook 2015<br />
India<br />
India<br />
Africa<br />
Africa<br />
2000–2005, but China increased its lead from<br />
2005 to 2010. This is surprising because China<br />
suffered disproportionately during 2007–2008.<br />
However, China bounced back immediately afterwards<br />
and continued gaining ground year-on-year.<br />
Equally importantly, its currency link with the US<br />
dollar means that its performance was not unduly<br />
affected by currency movements. This contrasts<br />
sharply with Africa and India, where depreciating<br />
currencies have offset underlying wealth growth<br />
since 2010, halting the momentum evident earlier<br />
this century. Latin America and the Asia-Pacific<br />
region (excluding China and India) have also<br />
recorded losses since 2010 when wealth is valued<br />
in current US dollars. Equally troubling is the downward<br />
trend of wealth growth for the world as a<br />
whole and for Europe in particular. North America is<br />
the only region for which wealth growth displays no<br />
downward trend over time; but it is also the region<br />
which suffered most during the crisis years, so its<br />
recent performance may simply reflect greater<br />
opportunities to recover.<br />
Reconfiguring the chart in terms of fixed<br />
exchange rates provides a more reassuring picture.<br />
As Figure 4 shows, all regions experienced wealth<br />
growth in each of the sub-intervals, except for<br />
North America which registered a fall of 2% in the<br />
crisis years. This confirms that exchange rate<br />
movements are masking a broadly positive wealth<br />
environment in most countries. Wealth growth still<br />
appears to be on a declining path, but the recent<br />
deceleration is fairly modest and may reflect the<br />
continuing aftermath of the financial crisis. Another<br />
striking feature of Figure 4 is the contrast between<br />
wealth growth in developing regions and performance<br />
in the “old world.” Once exchange rate<br />
movements are set aside, wealth in China, India,<br />
Africa and Latin America has been growing at<br />
between twice and three times the rate in Europe<br />
or North America. In part this difference reflects<br />
consumer price inflation in the developing world,<br />
which is typically higher than in Europe or North<br />
America, especially now that inflation targeting has<br />
become the norm in many advanced economies.<br />
Trends in average wealth across countries<br />
The division of this century into five-year sub-periods<br />
provides a convenient framework for examining<br />
wealth growth in 58 countries for which we have<br />
adequate data. We consider changes in wealth per<br />
adult in domestic currencies to control for exchange<br />
rate movements and population growth, and adjust<br />
for domestic inflation using the CPI for each country.<br />
Among the countries examined, the median<br />
real annual growth rate this century has been 2%.<br />
As Table 1 shows, median real growth was double<br />
this rate during the early years, but the financial<br />
crisis reduced the average to just 0.5% between<br />
2005 and 2010; and while growth has recovered<br />
since 2010, the median value of 1.1% per annum<br />
16 Global Wealth Report 2015