Research Institute
ekthsi_0
ekthsi_0

You also want an ePaper? Increase the reach of your titles
YUMPU automatically turns print PDFs into web optimized ePapers that Google loves.
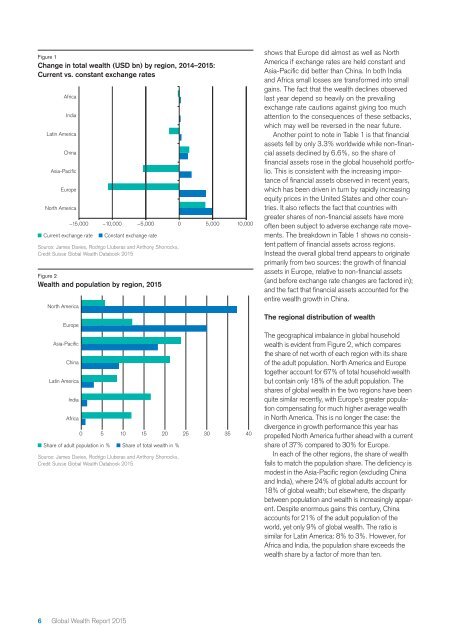
Figure 1<br />
Change in total wealth (USD bn) by region, 2014–2015:<br />
Current vs. constant exchange rates<br />
Africa<br />
India<br />
Latin America<br />
China<br />
Asia-Pacific<br />
Europe<br />
North America<br />
North America<br />
Europe<br />
Asia-Pacific<br />
China<br />
Latin America<br />
–15,000 –10,000 –5,000 0 5,000 10,000<br />
Current exchange rate<br />
India<br />
Africa<br />
Share of adult population in %<br />
Constant exchange rate<br />
Source: James Davies, Rodrigo Lluberas and Anthony Shorrocks,<br />
Credit Suisse Global Wealth Databook 2015<br />
Figure 2<br />
Wealth and population by region, 2015<br />
0 5 10 15 20 25 30 35 40<br />
Share of total wealth in %<br />
Source: James Davies, Rodrigo Lluberas and Anthony Shorrocks,<br />
Credit Suisse Global Wealth Databook 2015<br />
shows that Europe did almost as well as North<br />
America if exchange rates are held constant and<br />
Asia-Pacific did better than China. In both India<br />
and Africa small losses are transformed into small<br />
gains. The fact that the wealth declines observed<br />
last year depend so heavily on the prevailing<br />
exchange rate cautions against giving too much<br />
attention to the consequences of these setbacks,<br />
which may well be reversed in the near future.<br />
Another point to note in Table 1 is that financial<br />
assets fell by only 3.3% worldwide while non-financial<br />
assets declined by 6.6%, so the share of<br />
financial assets rose in the global household portfolio.<br />
This is consistent with the increasing importance<br />
of financial assets observed in recent years,<br />
which has been driven in turn by rapidly increasing<br />
equity prices in the United States and other countries.<br />
It also reflects the fact that countries with<br />
greater shares of non-financial assets have more<br />
often been subject to adverse exchange rate movements.<br />
The breakdown in Table 1 shows no consistent<br />
pattern of financial assets across regions.<br />
Instead the overall global trend appears to originate<br />
primarily from two sources: the growth of financial<br />
assets in Europe, relative to non-financial assets<br />
(and before exchange rate changes are factored in);<br />
and the fact that financial assets accounted for the<br />
entire wealth growth in China.<br />
The regional distribution of wealth<br />
The geographical imbalance in global household<br />
wealth is evident from Figure 2, which compares<br />
the share of net worth of each region with its share<br />
of the adult population. North America and Europe<br />
together account for 67% of total household wealth<br />
but contain only 18% of the adult population. The<br />
shares of global wealth in the two regions have been<br />
quite similar recently, with Europe’s greater population<br />
compensating for much higher average wealth<br />
in North America. This is no longer the case: the<br />
divergence in growth performance this year has<br />
propelled North America further ahead with a current<br />
share of 37% compared to 30% for Europe.<br />
In each of the other regions, the share of wealth<br />
fails to match the population share. The deficiency is<br />
modest in the Asia-Pacific region (excluding China<br />
and India), where 24% of global adults account for<br />
18% of global wealth; but elsewhere, the disparity<br />
between population and wealth is increasingly apparent.<br />
Despite enormous gains this century, China<br />
accounts for 21% of the adult population of the<br />
world, yet only 9% of global wealth. The ratio is<br />
similar for Latin America: 8% to 3%. However, for<br />
Africa and India, the population share exceeds the<br />
wealth share by a factor of more than ten.<br />
6 Global Wealth Report 2015