Research Institute
ekthsi_0
ekthsi_0

You also want an ePaper? Increase the reach of your titles
YUMPU automatically turns print PDFs into web optimized ePapers that Google loves.
United States<br />
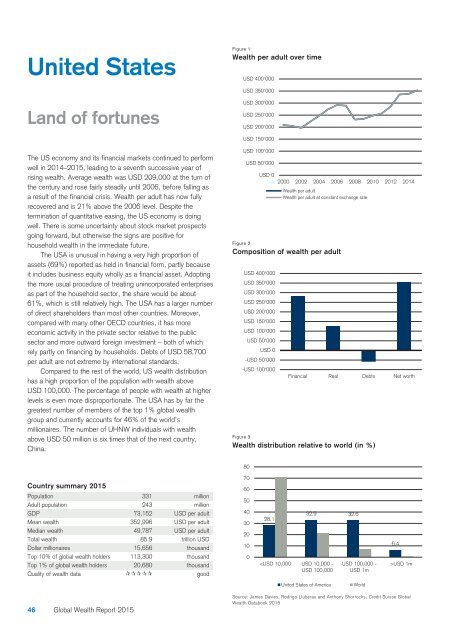
Figure 1<br />
Wealth per adult over time<br />
USD 400'000<br />
USD 350'000<br />
Land of fortunes<br />
USD 300'000<br />
USD 250'000<br />
USD 200'000<br />
USD 150'000<br />
The US economy and its financial markets continued to perform<br />
well in 2014–2015, leading to a seventh successive year of<br />
rising wealth. Average wealth was USD 209,000 at the turn of<br />
the century and rose fairly steadily until 2006, before falling as<br />
a result of the financial crisis. Wealth per adult has now fully<br />
recovered and is 21% above the 2006 level. Despite the<br />
termination of quantitative easing, the US economy is doing<br />
well. There is some uncertainty about stock market prospects<br />
going forward, but otherwise the signs are positive for<br />
household wealth in the immediate future.<br />
The USA is unusual in having a very high proportion of<br />
assets (69%) reported as held in financial form, partly because<br />
it includes business equity wholly as a financial asset. Adopting<br />
the more usual procedure of treating unincorporated enterprises<br />
as part of the household sector, the share would be about<br />
61%, which is still relatively high. The USA has a larger number<br />
of direct shareholders than most other countries. Moreover,<br />
compared with many other OECD countries, it has more<br />
economic activity in the private sector relative to the public<br />
sector and more outward foreign investment – both of which<br />
rely partly on financing by households. Debts of USD 58,700<br />
per adult are not extreme by international standards.<br />
Compared to the rest of the world, US wealth distribution<br />
has a high proportion of the population with wealth above<br />
USD 100,000. The percentage of people with wealth at higher<br />
levels is even more disproportionate. The USA has by far the<br />
greatest number of members of the top 1% global wealth<br />
group and currently accounts for 46% of the world’s<br />
millionaires. The number of UHNW individuals with wealth<br />
above USD 50 million is six times that of the next country,<br />
China.<br />
USD 100'000<br />
USD 50'000<br />
USD 0<br />
2000 2002 2004 2006 2008 2010 2012 2014<br />
Wealth per adult<br />
Wealth per adult at constant exchange rate<br />
Figure 2<br />
Composition of wealth per adult<br />
USD 400'000<br />
USD 350'000<br />
USD 300'000<br />
USD 250'000<br />
USD 200'000<br />
USD 150'000<br />
USD 100'000<br />
USD 50'000<br />
USD 0<br />
-USD 50'000<br />
-USD 100'000<br />
Financial Real Debts Net worth<br />
Figure 3<br />
Wealth distribution relative to world (in %)<br />
80<br />
Country summary 2015<br />
Population 331 million<br />
Adult population 243 million<br />
GDP 73,152 USD per adult<br />
Mean wealth 352,996 USD per adult<br />
Median wealth 49,787 USD per adult<br />
Total wealth 85.9 trillion USD<br />
Dollar millionaires 15,656 thousand<br />
Top 10% of global wealth holders 113,300 thousand<br />
Top 1% of global wealth holders 20,680 thousand<br />
Quality of wealth data good<br />
70<br />
60<br />
50<br />
40<br />
30<br />
20<br />
10<br />
0<br />
28.1<br />
32.9 32.6<br />
USD 1m<br />
United States of America<br />
World<br />
46 Global Wealth Report 2015<br />
Source: James Davies, Rodrigo Lluberas and Anthony Shorrocks, Credit Suisse Global<br />
Wealth Databook 2015