Research Institute
ekthsi_0
ekthsi_0

Create successful ePaper yourself
Turn your PDF publications into a flip-book with our unique Google optimized e-Paper software.
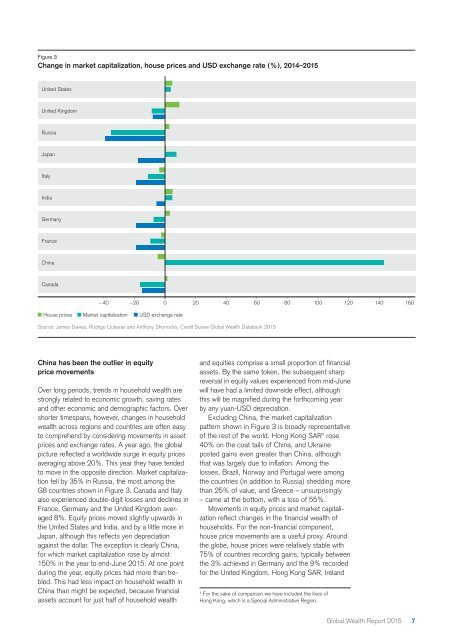
Figure 3<br />
Change in market capitalization, house prices and USD exchange rate (%), 2014–2015<br />
United States<br />
United Kingdom<br />
Russia<br />
Japan<br />
Italy<br />
India<br />
Germany<br />
France<br />
China<br />
Canada<br />
– 40 –20 0 20 40 60 80 100 120 140 160<br />
House prices Market capitalization USD exchange rate<br />
Source: James Davies, Rodrigo Lluberas and Anthony Shorrocks, Credit Suisse Global Wealth Databook 2015<br />
China has been the outlier in equity<br />
price movements<br />
Over long periods, trends in household wealth are<br />
strongly related to economic growth, saving rates<br />
and other economic and demographic factors. Over<br />
shorter timespans, however, changes in household<br />
wealth across regions and countries are often easy<br />
to comprehend by considering movements in asset<br />
prices and exchange rates. A year ago, the global<br />
picture reflected a worldwide surge in equity prices<br />
averaging above 20%. This year they have tended<br />
to move in the opposite direction. Market capitalization<br />
fell by 35% in Russia, the most among the<br />
G8 countries shown in Figure 3. Canada and Italy<br />
also experienced double-digit losses and declines in<br />
France, Germany and the United Kingdom averaged<br />
8%. Equity prices moved slightly upwards in<br />
the United States and India, and by a little more in<br />
Japan, although this reflects yen depreciation<br />
against the dollar. The exception is clearly China,<br />
for which market capitalization rose by almost<br />
150% in the year to end-June 2015. At one point<br />
during the year, equity prices had more than trebled.<br />
This had less impact on household wealth in<br />
China than might be expected, because financial<br />
assets account for just half of household wealth<br />
and equities comprise a small proportion of financial<br />
assets. By the same token, the subsequent sharp<br />
reversal in equity values experienced from mid-June<br />
will have had a limited downside effect, although<br />
this will be magnified during the forthcoming year<br />
by any yuan-USD depreciation.<br />
Excluding China, the market capitalization<br />
pattern shown in Figure 3 is broadly representative<br />
of the rest of the world. Hong Kong SAR 1 rose<br />
40% on the coat tails of China, and Ukraine<br />
posted gains even greater than China, although<br />
that was largely due to inflation. Among the<br />
losses, Brazil, Norway and Portugal were among<br />
the countries (in addition to Russia) shedding more<br />
than 25% of value, and Greece – unsurprisingly<br />
– came at the bottom, with a loss of 55%.<br />
Movements in equity prices and market capitalization<br />
reflect changes in the financial wealth of<br />
households. For the non-financial component,<br />
house price movements are a useful proxy. Around<br />
the globe, house prices were relatively stable with<br />
75% of countries recording gains, typically between<br />
the 3% achieved in Germany and the 9% recorded<br />
for the United Kingdom. Hong Kong SAR, Ireland<br />
1<br />
For the sake of comparison we have included the likes of<br />
Hong Kong, which is a Special Administrative Region.<br />
Global Wealth Report 2015<br />
7