
Create successful ePaper yourself
Turn your PDF publications into a flip-book with our unique Google optimized e-Paper software.
STRONG ON CONSUMPTION<br />
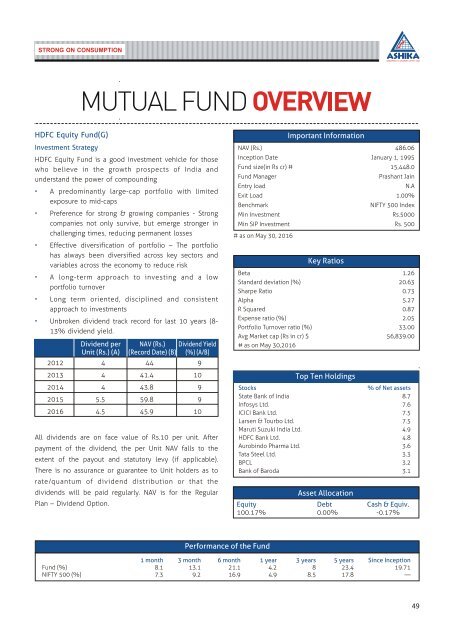
HDFC Equity Fund(G)<br />
Investment Strategy<br />
HDFC Equity Fund is a good investment vehicle for those<br />
who believe in the growth prospects of India and<br />
understand the power of compounding<br />
•<br />
•<br />
•<br />
•<br />
•<br />
•<br />
A predominantly large-cap portfolio with limited<br />
exposure to mid-caps<br />
Preference for strong & growing companies - Strong<br />
companies not only survive, but emerge stronger in<br />
challenging times, reducing permanent losses<br />
Effective diversification of portfolio – The portfolio<br />
has always been diversified across key sectors and<br />
variables across the economy to reduce risk<br />
A long-term approach to investing and a low<br />
portfolio turnover<br />
Long term oriented, disciplined and consistent<br />
approach to investments<br />
Unbroken dividend track record for last 10 years (8-<br />
13% dividend yield.<br />
Dividend per<br />
Unit (Rs.) (A)<br />
NAV (Rs.) Dividend Yield<br />
(Record Date) (B) (%) (A/B)<br />
2012 4 44 9<br />
2013 4 41.4 10<br />
2014 4 43.8 9<br />
2015 5.5 59.8 9<br />
<strong>2016</strong> 4.5 45.9 10<br />
All dividends are on face value of Rs.10 per unit. After<br />
payment of the dividend, the per Unit NAV falls to the<br />
extent of the payout and statutory levy (if applicable).<br />
There is no assurance or guarantee to Unit holders as to<br />
rate/quantum of dividend distribution or that the<br />
dividends will be paid regularly. NAV is for the Regular<br />
Plan – Dividend Option.<br />
NAV (Rs.) 486.06<br />
Inception Date January 1, 1995<br />
Fund size(in Rs cr) # 15,448.0<br />
Fund Manager Prashant Jain<br />
Entry load<br />
N.A<br />
Exit Load 1.00%<br />
Benchmark<br />
Min Investment<br />
NIFTY 500 Index<br />
Rs.5000<br />
Min SIP Investment Rs. 500<br />
# as on May 30, <strong>2016</strong><br />
Beta 1.26<br />
Standard deviation (%) 20.63<br />
Sharpe Ratio 0.73<br />
Alpha 5.27<br />
R Squared 0.87<br />
Expense ratio (%) 2.05<br />
Portfolio Turnover ratio (%) 33.00<br />
Avg Market cap (Rs in cr) $ 56,839.00<br />
# as on May 30,<strong>2016</strong><br />
Important Information<br />
Key Ratios<br />
Top Ten Holdings<br />
Stocks<br />
% of Net assets<br />
State Bank of India 8.7<br />
Infosys Ltd. 7.6<br />
ICICI Bank Ltd. 7.5<br />
Larsen & Tourbo Ltd. 7.5<br />
Maruti Suzuki India Ltd. 4.9<br />
HDFC Bank Ltd. 4.8<br />
Aurobindo Pharma Ltd. 3.6<br />
Tata Steel Ltd. 3.3<br />
BPCL 3.2<br />
Bank of Baroda 3.1<br />
Asset Allocation<br />
Equity Debt Cash & Equiv.<br />
100.17% 0.00% -0.17%<br />
Performance of the Fund<br />
1 month 3 month 6 month 1 year 3 years 5 years Since Inception<br />
Fund (%) 8.1 13.1 21.1 4.2 8 23.4 19.71<br />
NIFTY 500 (%) 7.3 9.2 16.9 4.9 8.5 17.8 —<br />
49