
You also want an ePaper? Increase the reach of your titles
YUMPU automatically turns print PDFs into web optimized ePapers that Google loves.
STRONG ON CONSUMPTION<br />
indicates that after every 8 year markets witness a major<br />
correction which is in the range of 20-60% The theory can<br />
be aptly applied in Indian markets as well as we witnessed<br />
a hefty correction in the year 1992 followed by a major<br />
correction in the year 2000, then in the year 2008 and<br />
now the year <strong>2016</strong> is the next in the eight year cycle.<br />
Calculation:<br />
Projected Price- Current Market price = 8800-8600 = 200<br />
Now, time required to complete the target = 200/2 = 100=<br />
3.33~4 months.<br />
Indian VIX<br />
Indian VIX signaled fall in volatility. A close observation<br />
of the Indian VIX reveals that the Index is a mean<br />
reverting one where it is now near to its historical level<br />
of 15-16. On the technical parlance not much inference<br />
can be drawn from the present setup and as the broader<br />
trend continues to remain negative with its consecutive<br />
lower low formation in daily chart. With a steady line up<br />
of crucial event in the forthcoming month like that of the<br />
monsoon session, policy meet by some global central<br />
banks it can be expected that Volatility in the market<br />
might increase in the forthcoming month which might not<br />
augur well for Nifty as an inverse relation seems to exist<br />
between each other.<br />
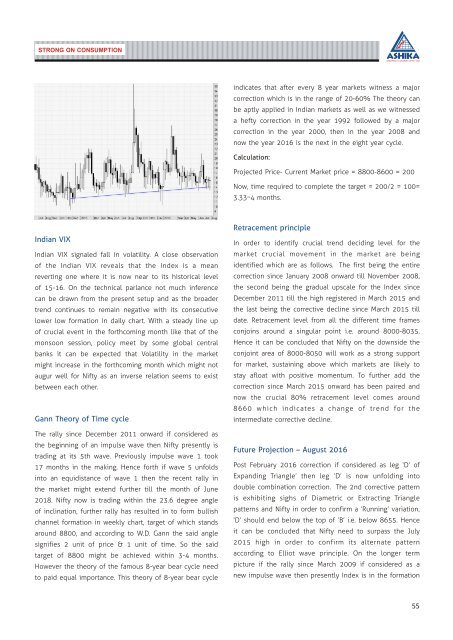
Gann Theory of Time cycle<br />
The rally since December 2011 onward if considered as<br />
the beginning of an impulse wave then Nifty presently is<br />
trading at its 5th wave. Previously impulse wave 1 took<br />
17 months in the making. Hence forth if wave 5 unfolds<br />
into an equidistance of wave 1 then the recent rally in<br />
the market might extend further till the month of June<br />
2018. Nifty now is trading within the 23.6 degree angle<br />
of inclination, further rally has resulted in to form bullish<br />
channel formation in weekly chart, target of which stands<br />
around 8800, and according to W.D. Gann the said angle<br />
signifies 2 unit of price & 1 unit of time. So the said<br />
target of 8800 might be achieved within 3-4 months.<br />
However the theory of the famous 8-year bear cycle need<br />
to paid equal importance. This theory of 8-year bear cycle<br />
Retracement principle<br />
In order to identify crucial trend deciding level for the<br />
market crucial movement in the market are being<br />
identified which are as follows. The first being the entire<br />
correction since January 2008 onward till November 2008,<br />
the second being the gradual upscale for the Index since<br />
December 2011 till the high registered in March 2015 and<br />
the last being the corrective decline since March 2015 till<br />
date. Retracement level from all the different time frames<br />
conjoins around a singular point i.e. around 8000-8035.<br />
Hence it can be concluded that Nifty on the downside the<br />
conjoint area of 8000-8050 will work as a strong support<br />
for market, sustaining above which markets are likely to<br />
stay afloat with positive momentum. To further add the<br />
correction since March 2015 onward has been paired and<br />
now the crucial 80% retracement level comes around<br />
8660 which indicates a change of trend for the<br />
intermediate corrective decline.<br />
Future Projection – <strong>August</strong> <strong>2016</strong><br />
Post February <strong>2016</strong> correction if considered as leg ‘D’ of<br />
Expanding Triangle’ then leg ‘D’ is now unfolding into<br />
double combination correction. The 2nd corrective pattern<br />
is exhibiting sighs of Diametric or Extracting Triangle<br />
patterns and Nifty in order to confirm a ‘Running’ variation,<br />
‘D’ should end below the top of ‘B’ i.e. below 8655. Hence<br />
it can be concluded that Nifty need to surpass the July<br />
2015 high in order to confirm its alternate pattern<br />
according to Elliot wave principle. On the longer term<br />
picture if the rally since March 2009 if considered as a<br />
new impulse wave then presently Index is in the formation<br />
55