
Create successful ePaper yourself
Turn your PDF publications into a flip-book with our unique Google optimized e-Paper software.
AUGUST <strong>2016</strong><br />
TECHNICAL OVERVIEW<br />
To sum up according to classical theory of Technical<br />
analysis market seems stretched for the time being and<br />
correction seems due in the market in the overall higher<br />
degree uptrend. In the forthcoming month market is likely<br />
to remain rangebound and new trading range for the<br />
market exist within 8250-8850.<br />
consolidation mode against which the Index had been<br />
slowly dripping towards its mid band. On the daily time<br />
frame immediate support from the said study exist around<br />
8400 while in weekly time frame the mid band exist<br />
around 8050. Present setup indicates that Nifty is in<br />
uptrend and intermediate correction would be temporary<br />
in nature which need to be utilized to enter long<br />
Modern approach in Technical Analysis<br />
The strong rally during the month lead to a reading in<br />
oscillator near to its overbought territory with slight<br />
divergence is also being observed through RSI which calls<br />
for a cautious approach in the market though current<br />
reading of 68 indicates room for further upside remains.<br />
MACD in both daily and weekly time frame has been in a<br />
rising trajectory, highlights the underlying strength in the<br />
ongoing trend and might augur well for the Index. ADX<br />
too seems positive as +DI continues to remain<br />
comfortably above the –DI however ADX line lies below<br />
20 level mark in weekly chart indicating clear uptrend<br />
still need to be explored. To sum up, with divergent view<br />
point market might remain rangebound in the forthcoming<br />
month as well.<br />
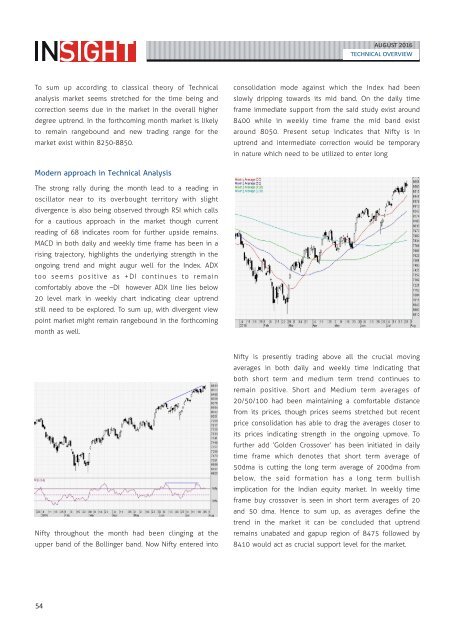
Nifty throughout the month had been clinging at the<br />
upper band of the Bollinger band. Now Nifty entered into<br />
Nifty is presently trading above all the crucial moving<br />
averages in both daily and weekly time indicating that<br />
both short term and medium term trend continues to<br />
remain positive. Short and Medium term averages of<br />
20/50/100 had been maintaining a comfortable distance<br />
from its prices, though prices seems stretched but recent<br />
price consolidation has able to drag the averages closer to<br />
its prices indicating strength in the ongoing upmove. To<br />
further add ‘Golden Crossover’ has been initiated in daily<br />
time frame which denotes that short term average of<br />
50dma is cutting the long term average of 200dma from<br />
below, the said formation has a long term bullish<br />
implication for the Indian equity market. In weekly time<br />
frame buy crossover is seen in short term averages of 20<br />
and 50 dma. Hence to sum up, as averages define the<br />
trend in the market it can be concluded that uptrend<br />
remains unabated and gapup region of 8475 followed by<br />
8410 would act as crucial support level for the market.<br />
54