

Driving operational performance in oil and gas
ey-driving-operational-performance-in-oil-and-gas
ey-driving-operational-performance-in-oil-and-gas

You also want an ePaper? Increase the reach of your titles
YUMPU automatically turns print PDFs into web optimized ePapers that Google loves.
2<br />
9<br />
7<br />
T he p ri z e o f o p e rat i o n al e x ce l l e n ce<br />
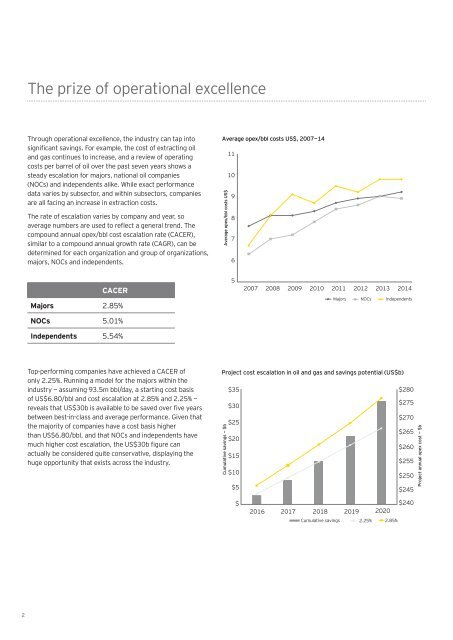
T hro u g h o p e rat i o n al e x ce l l e n ce , t he i n d u s t ry can t ap i n t o A verage opex / b b l costs U S $ , 2 0 0 7 — 1 4<br />
significant sav<strong>in</strong>gs. For example, the cost of extract<strong>in</strong>g <strong>oil</strong><br />
11<br />
an d g as co n t i n u e s t o i n cre as e , an d a re v i e w o f o p e rat i n g<br />
co s t s p e r b arre l o f o i l o v e r t he p as t s e v e n y e ars s ho w s a<br />
s t e ad y e s cal at i o n f o r m aj o rs , n at i o n al o i l co m p an i e s<br />
10<br />
(NOCs) <strong>and</strong> <strong>in</strong>dependents alike. While exact <strong>performance</strong><br />
d at a v ari e s b y s u b s e ct o r, an d w i t hi n s u b s e ct o rs , co m p an i e s<br />
are al l f aci n g an i n cre as e i n e x t ract i o n co s t s .<br />
T he rat e o f e s cal at i o n v ari e s b y co m p an y an d y e ar, s o 8<br />
average numbers are used to reflect a general trend. The<br />
compound annual opex/bbl cost escalation rate (CACER),<br />
similar to a compound annual growth rate (CAGR), can be<br />
d e t e rm i n e d f o r e ach o rg an i z at i o n an d g ro u p o f o rg an i z at i o n s ,<br />
majors, NOCs <strong>and</strong> <strong>in</strong>dependents.<br />
6<br />
A verage opex / b b l costs U S $<br />
C A C E R<br />
M a j o r s 2. 85%<br />
N O C s 5. 01%<br />
I n d e p e n d e n t s 5. 54%<br />
5<br />
2007 2008 2009 2010 2011 2012 2013 2014<br />
Maj o rs N O C s I n d e p e n d e n t s<br />
Top-perform<strong>in</strong>g companies have achieved a CACER of<br />
P roj ect cost escalation <strong>in</strong> <strong>oil</strong> <strong>and</strong> <strong>gas</strong> <strong>and</strong> sav<strong>in</strong>gs potential ( U S $ b )<br />
only 2.25%. Runn<strong>in</strong>g a model for the majors with<strong>in</strong> the<br />
i n d u s t ry — as s u m i n g 9 3. 5m b b l / d ay , a s t art i n g co s t b as i s $35<br />
$280<br />
of US$6.80/bbl <strong>and</strong> cost escalation at 2.85% <strong>and</strong> 2.25% —<br />
$27 5<br />
reveals that US$30b is available to be saved over five years $30<br />
between best-<strong>in</strong>-class <strong>and</strong> average <strong>performance</strong>. Given that<br />
$27 0<br />
$25<br />
t he m aj o ri t y o f co m p an i e s hav e a co s t b as i s hi g he r<br />
$265<br />
than US$6.80/bbl, <strong>and</strong> that NOCs <strong>and</strong> <strong>in</strong>dependents have<br />
$20<br />
much higher cost escalation, the US$30b figure can<br />
$260<br />
actually be considered quite conservative, display<strong>in</strong>g the<br />
$15<br />
hu g e o p p o rt u n i t y t hat e x i s t s acro s s t he i n d u s t ry .<br />
$255<br />
C u mu lative sav<strong>in</strong>gs — $ b<br />
$10<br />
$5<br />
$250<br />
$245<br />
P roj ect annu al opex cost — $ b<br />
$<br />
2016<br />
2017<br />
$240<br />
2018 2019 2020<br />
C u m<br />
u l at i v e s av i n g s 2. 25% 2. 85%
