16-10-17 POLL POOP

You also want an ePaper? Increase the reach of your titles
YUMPU automatically turns print PDFs into web optimized ePapers that Google loves.
<strong>POLL</strong> <strong>POOP</strong> – A DIVE BELOW THE HEADLINES <strong>10</strong>/<strong>17</strong>/20<strong>16</strong><br />
DECONSTRUCTING THE (CNN) CLINTON NEWS<br />
NETWORK’S “<strong>POLL</strong> OF <strong>POLL</strong>S”<br />
The Clinton News Network (CNN) just published their “Poll of Polls” showing Hillary Clinton with an 8 point lead<br />
– Clinton 47%, Trump 39%, Johnson 7%, Stein 2% - in a four way race. The “Poll of Polls” is CNN’s average of the<br />
results of 4 previously published polls:<br />
Fox News Poll <strong>10</strong>/<strong>10</strong> – <strong>10</strong>/12<br />
Washington Post/ABC News Poll <strong>10</strong>/<strong>10</strong> – <strong>10</strong>/13<br />
NBC News/Wall Street Journal Poll <strong>10</strong>/<strong>10</strong> – <strong>10</strong>/13<br />
GW Battleground Poll <strong>10</strong>/8 – <strong>10</strong>/13<br />
On <strong>10</strong>/15 I wrote about the irregularities and bias in the Fox poll. I’ll get into the other three here. Before I do I want<br />
to say that I look at the numbers in these polls along with the methodology. It seems that skewing the number of<br />
respondents by party affiliation with higher numbers of Democratic respondents and gender with higher numbers of<br />
female respondents is the most common thread in all these crooked polls that are done in the hopes that folks only<br />
read the headlines.<br />
From Gallup data for 2015 I found that our country was ID’d by them as 26% Republican and 29% Democrat. Why<br />
don’t the polls use a count to get real close to a 3% split not a +9 Democratic advantage like in the Fox poll?<br />
The 20<strong>10</strong> US Census data had our population split by gender as Female 50.8%-Male 49.2% with the male<br />
population 2000-20<strong>10</strong> increasing faster than the female population. So any poll that wants to lean female is not<br />
representative and I find most polls do. Some stretch that to a 6 point differential and claim that Clinton has a 4 point<br />
lead. In this election gender is more critical than in elections past.<br />
Another aside before I dive – the GW Battleground Poll has a link to a “Republican Analysis”. I read that and said to<br />
myself “Who the hell is this Republican?” RHINO? Not really. Some guy or gal who hasn’t gotten off the<br />
reservation to see what the folks are really saying. You see, on the reservation (Washington DC and its surrounds)<br />
the analysis is “just right”. Then it dawned on me “GW” poll. George Washington University in Washington, DC.<br />
UNBIASED?<br />
Here’s the “<strong>POOP</strong> DIVE”:<br />
Washington Post/ABC Poll<br />
1) When I looked at the actual Washington Post/ABC poll results there was a separate link to “Data: Complete<br />
trends over time”. Going there I found out the poll’s published data on how they determined the number of<br />
respondents. They completed 1152 interviews from which 920 registered voters and 740 likely voters are<br />
determined and used to generate poll results.<br />
In order to understand how 1152 becomes 920 and then becomes 740, the pollsters say that you need to<br />
understand that “this survey uses statistical weighting procedures to account for deviations in the<br />
survey sample from known population characteristics, which helps correct for differential survey<br />
participation and random variation in samples”.<br />
I’m just a simple kind of guy but that line sounds like “this survey has been rigged to the benefit of<br />
the Democratic candidate, but TRUST US.
2) The male/female count. This poll has percentages as answers for all questions. Nowhere within the poll<br />
can you find the number, not a percentage, of male/female respondents. In their fancy electronic view of<br />
the poll you can get a “detailed view” under a tab with that name. When you open that view up you can<br />
look at things a number of ways but they never tell you how many male respondents and female<br />
respondents there were by a number count. IS THERE SOMETHING HERE THAT COULD<br />
EVIDENCE A BIAS?<br />
3) Party affiliation. Again, just like the gender question, the only facts you get about party affiliation is in<br />
percentages so you can’t actually get a count by party. Based on answers to the last poll question, 33% of<br />
respondents ID’d themselves as Democrat, 25% Republican, 33% Independent, 5% Other, 4% No Opinion.<br />
Obviously leaning left quite a bit. There’s a +8 Democratic tilt from the jump. I’d love to hear who the<br />
4% No Opinion folks were and if they participated in other answers. That makes no sense at all.<br />
NBC News/Wall Street Journal Poll<br />
1) When I looked at the actual NBC News/Wall Street Journal poll results there was what I can only describe<br />
as a “perfect setup” for biased answers to the questions from which the published poll headlines would be<br />
created. Seven questions into the poll interview, respondents are asked if they’re likely to vote and then<br />
they can move on to question 8, from which the poll’s headlines about who’s in the lead are drawn. In the<br />
six questions leading up to the “headline questions”, respondents are asked how they feel about Trump,<br />
Clinton, Pence, Kaine, Michelle Obama, Barack Obama, Alicia Machado, Paul Ryan, the Democratic<br />
Party, the Republican Party. WHY?<br />
2) The male/female count. This poll has a female advantage 53% to 47% male. Let’s go to 50/50 based on<br />
census. That’s a 6 point differential. The poll now comes down to a 5 point race and we haven’t even talked<br />
about the party affiliation differential.<br />
3) Party affiliation. As Donald Trump says “Follow the numbers”. In poll question QF1 we find that 46% of<br />
respondents voted for Obama in 2012 and 32% voted for Romney. In poll question QF4 we find that 26%<br />
of the respondents are “Strong Democrat” versus 19% who are “Strong Republicans”. NO POTENTIAL<br />
<strong>POLL</strong> BIAS HERE.<br />
GW Battleground Poll<br />
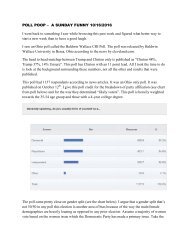
1) I went to the GW Battleground Poll site and checked a link called “Polling Data (cross tabs)”. As opposed<br />
to info provided by other polls that only gives percentages, this data, with a heading of ‘The Tarrance<br />
Group, Inc./Lake Research Partners Battleground #15380: Weighted Tables October 8-13, 20<strong>16</strong>’,<br />
provides a body count for answers to poll specifics. Every polling firm should be associated with The<br />
Tarrance Group or another firm offering the same ability to produce “weighted” tables. Weighted?<br />
2) The male/female count. This poll has a female advantage 531 to 470 male. Again this is the same 53/47<br />
advantage that NBC used above. Just like that poll, let’s go to 50/50 based on census. That’s a 6 point<br />
differential. This poll now comes down to a 2 point race and we haven’t even talked about the party<br />
affiliation differential.<br />
3) Party affiliation. Using the polling data referenced in #1 above, there’s a cross column labeled “Partisan”.<br />
This cross column reflected these responses:<br />
Hard GOP – 291 respondents<br />
Soft GOP – 98 respondents<br />
Ticket Splitters – <strong>17</strong>6 respondents<br />
Soft DEM – 69 respondents<br />
Hard DEM - 367 respondents<br />
Great Question Should Be In Every Poll<br />
Using these numbers, GOP vs DEM without Ticket Splitters favors Democrats 53% to 47%. Using just the<br />
strong partisan respondents the Democratic advantage grows to 56% to 44%. We had this poll down to a 2<br />
pointer using gender, are we even now?
LOOKS LIKE A BLUE LEANER, SMELLS LIKE A BLUE LEANER, HELL, MUST BE A BLUE<br />
LEANER. IT’S SO NICE TO BE ABLE TO MAKE THE FINDINGS SHOWING WE HAVE<br />
MEDIA ALONG WITH THEIR CRONIES THAT HAVE TRIED TO DECEIVE THE AMERICAN<br />
VOTERS.<br />
SO GOOD LUCK:<br />
CNN – CLINTON NEWS NETWORK<br />
ABC – AMATUERS BACKING CLINTON<br />
CBS – CLINTON BUTT SUCKERS<br />
NBC – NOBODY BUT CLINTON<br />
MSNBC – NOBODY BUT CLINTON – MORE STEROIDS<br />
FOLKS ARE WATCHING.<br />
In summary, this is why the ‘Poll of Polls’ is biased. The problem with<br />
disseminating this false data in the form of a blaring but untrue<br />
headline is the effect on decisions being made by “LIV’s” (Low<br />
Information Voters).<br />
Please forward this to your family and friends and ask them to bring up the crooked polling and<br />
back it up with facts when they have the opportunity to discuss the upcoming election with a<br />
reasonable individual. There’s a problem there too. When I try to have a reasonable discussion<br />
with a Democrat, it takes about 5-<strong>10</strong> words before the “Trump” word is spoken by them<br />
followed by a rant and a refusal to talk reasonably and discuss facts.<br />
Be strong in your position