16-10-15 POLL POOP
TAKING ON THE BIG DOG - FOX NEWS POLL
TAKING ON THE BIG DOG - FOX NEWS POLL
Create successful ePaper yourself
Turn your PDF publications into a flip-book with our unique Google optimized e-Paper software.
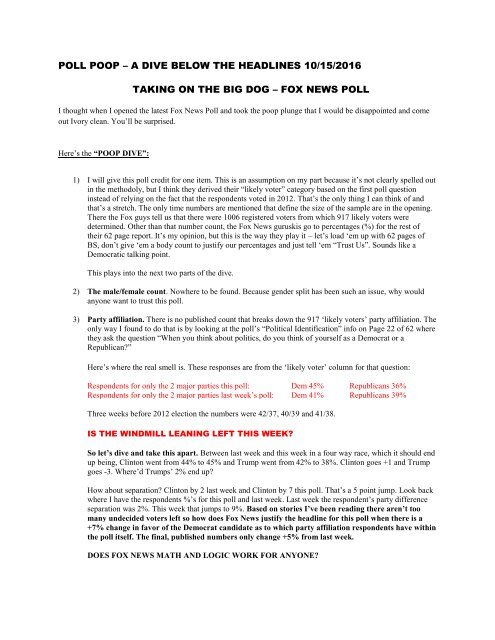
<strong>POLL</strong> <strong>POOP</strong> – A DIVE BELOW THE HEADLINES <strong>10</strong>/<strong>15</strong>/20<strong>16</strong><br />
TAKING ON THE BIG DOG – FOX NEWS <strong>POLL</strong><br />
I thought when I opened the latest Fox News Poll and took the poop plunge that I would be disappointed and come<br />
out Ivory clean. You’ll be surprised.<br />
Here’s the “<strong>POOP</strong> DIVE”:<br />
1) I will give this poll credit for one item. This is an assumption on my part because it’s not clearly spelled out<br />
in the methodoly, but I think they derived their “likely voter” category based on the first poll question<br />
instead of relying on the fact that the respondents voted in 2012. That’s the only thing I can think of and<br />
that’s a stretch. The only time numbers are mentioned that define the size of the sample are in the opening.<br />
There the Fox guys tell us that there were <strong>10</strong>06 registered voters from which 917 likely voters were<br />
determined. Other than that number count, the Fox News guruskis go to percentages (%) for the rest of<br />
their 62 page report. It’s my opinion, but this is the way they play it – let’s load ‘em up with 62 pages of<br />
BS, don’t give ‘em a body count to justify our percentages and just tell ‘em “Trust Us”. Sounds like a<br />
Democratic talking point.<br />
This plays into the next two parts of the dive.<br />
2) The male/female count. Nowhere to be found. Because gender split has been such an issue, why would<br />
anyone want to trust this poll.<br />
3) Party affiliation. There is no published count that breaks down the 917 ‘likely voters’ party affiliation. The<br />
only way I found to do that is by looking at the poll’s “Political Identification” info on Page 22 of 62 where<br />
they ask the question “When you think about politics, do you think of yourself as a Democrat or a<br />
Republican?”<br />
Here’s where the real smell is. These responses are from the ‘likely voter’ column for that question:<br />
Respondents for only the 2 major parties this poll: Dem 45% Republicans 36%<br />
Respondents for only the 2 major parties last week’s poll: Dem 41% Republicans 39%<br />
Three weeks before 2012 election the numbers were 42/37, 40/39 and 41/38.<br />
IS THE WINDMILL LEANING LEFT THIS WEEK?<br />
So let’s dive and take this apart. Between last week and this week in a four way race, which it should end<br />
up being, Clinton went from 44% to 45% and Trump went from 42% to 38%. Clinton goes +1 and Trump<br />
goes -3. Where’d Trumps’ 2% end up?<br />
How about separation? Clinton by 2 last week and Clinton by 7 this poll. That’s a 5 point jump. Look back<br />
where I have the respondents %’s for this poll and last week. Last week the respondent’s party difference<br />
separation was 2%. This week that jumps to 9%. Based on stories I’ve been reading there aren’t too<br />
many undecided voters left so how does Fox News justify the headline for this poll when there is a<br />
+7% change in favor of the Democrat candidate as to which party affiliation respondents have within<br />
the poll itself. The final, published numbers only change +5% from last week.<br />
DOES FOX NEWS MATH AND LOGIC WORK FOR ANYONE?
I’m using my slide rule along with a very, very strong assumption that if you said you were Democrat in<br />
this poll, you were committed to your candidate. Then, if those respondents who ID’d themselves as<br />
Democrats goes up by 7% and the Clinton lead only goes up by 5%, there’s a minus 2 differential there.<br />
Apply that to last week’s poll results – Clinton 44%, Trump 42% - and this week’s poll results would be<br />
more like an even race and the published headline changes.<br />
Correct me if I’m wrong.<br />
In summary, this is why this poll is biased. The problem with<br />
disseminating this false data in the form of a blaring but untrue<br />
headline is the effect on decisions being made by “LIV’s” (Low<br />
Information Voters).<br />
Please forward this to your family and friends and ask them to bring up the crooked polling and back it up with facts<br />
when they have the opportunity to discuss the upcoming election with a reasonable individual. There’s a problem<br />
there too. When I try to have a reasonable discussion with a Democrat, it takes about 5-<strong>10</strong> words before the<br />
“Trump” word is spoken by them followed by a rant and a refusal to talk reasonably and discuss facts.<br />
Be strong in your position


