16-10-18 POLL POOP - CBS POLL
WHAT ARE THEY HIDING
WHAT ARE THEY HIDING

You also want an ePaper? Increase the reach of your titles
YUMPU automatically turns print PDFs into web optimized ePapers that Google loves.
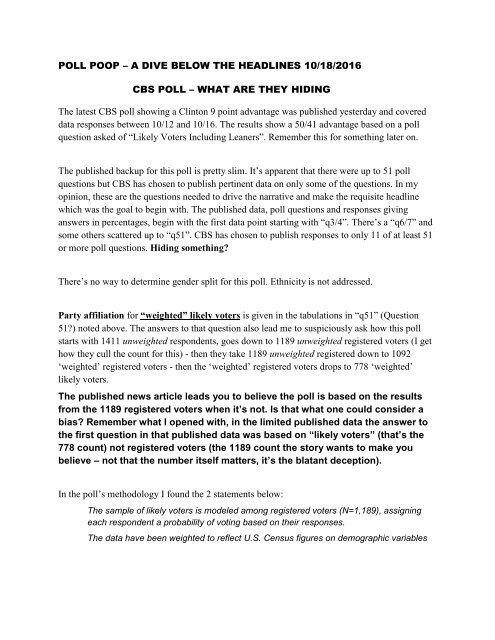
<strong>POLL</strong> <strong>POOP</strong> – A DIVE BELOW THE HEADLINES <strong>10</strong>/<strong>18</strong>/20<strong>16</strong><br />
<strong>CBS</strong> <strong>POLL</strong> – WHAT ARE THEY HIDING<br />
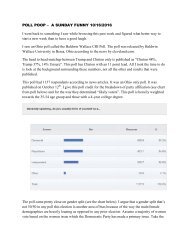
The latest <strong>CBS</strong> poll showing a Clinton 9 point advantage was published yesterday and covered<br />
data responses between <strong>10</strong>/12 and <strong>10</strong>/<strong>16</strong>. The results show a 50/41 advantage based on a poll<br />
question asked of “Likely Voters Including Leaners”. Remember this for something later on.<br />
The published backup for this poll is pretty slim. It’s apparent that there were up to 51 poll<br />
questions but <strong>CBS</strong> has chosen to publish pertinent data on only some of the questions. In my<br />
opinion, these are the questions needed to drive the narrative and make the requisite headline<br />
which was the goal to begin with. The published data, poll questions and responses giving<br />
answers in percentages, begin with the first data point starting with “q3/4”. There’s a “q6/7” and<br />
some others scattered up to “q51”. <strong>CBS</strong> has chosen to publish responses to only 11 of at least 51<br />
or more poll questions. Hiding something?<br />
There’s no way to determine gender split for this poll. Ethnicity is not addressed.<br />
Party affiliation for “weighted” likely voters is given in the tabulations in “q51” (Question<br />
51?) noted above. The answers to that question also lead me to suspiciously ask how this poll<br />
starts with 1411 unweighted respondents, goes down to 1<strong>18</strong>9 unweighted registered voters (I get<br />
how they cull the count for this) - then they take 1<strong>18</strong>9 unweighted registered down to <strong>10</strong>92<br />
‘weighted’ registered voters - then the ‘weighted’ registered voters drops to 778 ‘weighted’<br />
likely voters.<br />
The published news article leads you to believe the poll is based on the results<br />
from the 1<strong>18</strong>9 registered voters when it’s not. Is that what one could consider a<br />
bias? Remember what I opened with, in the limited published data the answer to<br />
the first question in that published data was based on “likely voters” (that’s the<br />
778 count) not registered voters (the 1<strong>18</strong>9 count the story wants to make you<br />
believe – not that the number itself matters, it’s the blatant deception).<br />
In the poll’s methodology I found the 2 statements below:<br />
The sample of likely voters is modeled among registered voters (N=1,<strong>18</strong>9), assigning<br />
each respondent a probability of voting based on their responses.<br />
The data have been weighted to reflect U.S. Census figures on demographic variables
Regarding modeling of a sample of registered voters as stated above, what determined the<br />
probability of voting? What U.S. Census figures are being used to weight data?<br />
The poll answers to “q51” in the tabulation provided in the limited published data broke out the<br />
various counts that made up the totals (1<strong>18</strong>9, <strong>10</strong>92 and 778) by party affiliation. The count they<br />
gave was a body count and I calculated the percentages (%) shown below.<br />
Unweighted Reg Voters (1,<strong>18</strong>9) Unweighted Reg Voters (1,092) Weighted Likely Voters (778)<br />
From Poll Calculated From Poll Calculated From Poll Calculated<br />
(R) 381 32.0% (R) 353 32.3% (R) 254 32.6%<br />
(D) 401 33.7% (D) 366 33.5% (D) 282 36.2%<br />
(I) 407 34.2% (I) 373 34.2% (I) 242 31.1%<br />
It makes a simple guy like me wonder how these machinations take place. It may not seem like<br />
much, but looking at the Democrat and Republican respondents by total percentage, getting from<br />
an unweighted Democrat registered voter to a participant in the final round up as a weighted<br />
Democrat likely voter, favored the Democrats.<br />
I feel like I dove deep enough and uncovered another tidbit – weighted data, when properly<br />
applied to the appropriate modeled sample is being manipulated to give a Democratic<br />
advantage. If weighted data was to yield unbiased results then how did the Independents<br />
take a deeper number dive reflected by %’s at the expense of the Democrats? I’m assuming<br />
the pollsters had all responses from the 1<strong>18</strong>9 registered voters when the culling began.<br />
What part of what answer that a Democrat gave to a question did Pollster Joe Democrat<br />
like more than the Independent’s answer? OPEN TO BIAS ANYONE?<br />
In summary, this is why the ‘<strong>CBS</strong> Poll’ is biased. The problem with<br />
disseminating this false data in the form of a blaring but untrue<br />
headline is the effect on decisions being made by “LIV’s” (Low<br />
Information Voters).<br />
Please forward this to your family and friends and ask them to bring up the crooked polling and<br />
back it up with facts when they have the opportunity to discuss the upcoming election with a<br />
reasonable individual. There’s a problem there too. When I try to have a reasonable discussion<br />
with a Democrat, it takes about 5-<strong>10</strong> words before the “Trump” word is spoken by them<br />
followed by a rant and a refusal to talk reasonably and discuss facts.<br />
Be strong in your position.