Divided City Life In Canada's Child Poverty Capital

Create successful ePaper yourself
Turn your PDF publications into a flip-book with our unique Google optimized e-Paper software.
DIVIDED CITY: <strong>Life</strong> in Canada’s <strong>Child</strong> <strong>Poverty</strong> <strong>Capital</strong><br />
2016 Toronto <strong>Child</strong> and Family <strong>Poverty</strong> Report Card<br />
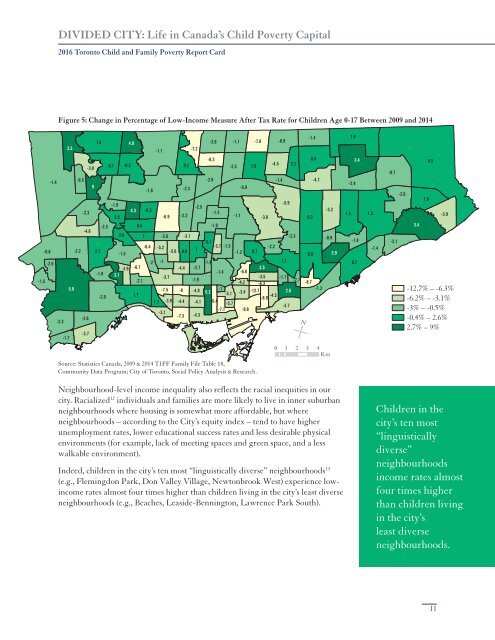
Figure 5: Change in Percentage of Low-<strong>In</strong>come Measure After Tax Rate for <strong>Child</strong>ren Age 0-17 Between 2009 and 2014<br />
1.6<br />
4.9<br />
-2.6 -1.1 -7.8 -0.9<br />
3.3<br />
-1.1<br />
-7.2<br />
-8.3<br />
0.7 -0.3<br />
0.2<br />
-2.5 1.8<br />
-4.5 2.2<br />
-3.8<br />
-1.4<br />
-0.5<br />
-2.9<br />
-1.4<br />
9<br />
-1.8<br />
-2.3<br />
-0.9<br />
-1.9<br />
-5.9<br />
-2.5<br />
-2.3<br />
4.3 -0.3<br />
-1.3<br />
2.5<br />
-6.9 -2.2<br />
-1.1 -3.8<br />
-2.5<br />
0.4<br />
-1.9<br />
-4.6<br />
2.6 1 -2.6 -3.1<br />
-2.3<br />
0.1<br />
-0.6 -2.2 2.1<br />
-6.4 -5.2<br />
-3.7 -1.5<br />
-2.2<br />
-5.6<br />
1<br />
-1.5<br />
0.6<br />
-1.2 0.7<br />
-2 -1<br />
1.1<br />
-2.6<br />
-1.4<br />
-3.9 -6.7<br />
-4.4 -2.7<br />
3.5<br />
-1.8<br />
-1.4 -6.8<br />
3.1<br />
-3.7<br />
-3.5 -1.1<br />
-1.5<br />
-2.1<br />
-1.9<br />
-4.2<br />
-2.7<br />
-6.3<br />
5.9<br />
-7.5 -8 -4.8 -1<br />
5.2<br />
-3.4 -12.7<br />
2.8<br />
-2.9<br />
1.7<br />
-5.1<br />
-4.5<br />
-8.9<br />
1.3 -3.9 -4.4 -4.1 -6.4<br />
-5.7<br />
-3.7<br />
-7.1 -9.6<br />
-3.1<br />
-7.3 -4.3<br />
-2.6<br />
-2.3<br />
-3.7<br />
-1.7<br />
N<br />
-1.4<br />
0.4<br />
-4.7<br />
-3.2<br />
0.3<br />
-0.9<br />
0.8 3.9<br />
-8.7<br />
-1.3<br />
1.4<br />
3.4<br />
-2.4<br />
1.5<br />
-1.8<br />
0.7<br />
1.5<br />
-1.4<br />
-0.7<br />
-2.1<br />
-2.6<br />
3.4<br />
1.6<br />
0.5<br />
-3.9<br />
-12.7% – -6.3%<br />
-6.2% – -3.1%<br />
-3% – -0.5%<br />
-0.4% – 2.6%<br />
2.7% – 9%<br />
0 1 2 3 4<br />
Km<br />
<strong>Child</strong>ren in the<br />
Source: Statistics Canada, 2009 & 2014 T1FF Family File Table 18,<br />
Community Data Program; <strong>City</strong> of Toronto, Social Policy Analysis & Research.<br />
Neighbourhood-level income inequality also reflects the racial inequities in our<br />
city. Racialized 12 individuals and families are more likely to live in inner suburban<br />
neighbourhoods where housing is somewhat more affordable, but where<br />
neighbourhoods – according to the <strong>City</strong>’s equity index – tend to have higher<br />
unemployment rates, lower educational success rates and less desirable physical<br />
environments (for example, lack of meeting spaces and green space, and a less<br />
walkable environment).<br />
<strong>In</strong>deed, children in the city’s ten most “linguistically diverse” neighbourhoods 13<br />
(e.g., Flemingdon Park, Don Valley Village, Newtonbrook West) experience lowincome<br />
rates almost four times higher than children living in the city’s least diverse<br />
neighbourhoods (e.g., Beaches, Leaside-Bennington, Lawrence Park South).<br />
city’s ten most<br />
“linguistically<br />
diverse”<br />
neighbourhoods<br />
income rates almost<br />
four times higher<br />
than children living<br />
in the city’s<br />
least diverse<br />
neighbourhoods.<br />
11