Divided City Life In Canada's Child Poverty Capital

Create successful ePaper yourself
Turn your PDF publications into a flip-book with our unique Google optimized e-Paper software.
DIVIDED CITY: <strong>Life</strong> in Canada’s <strong>Child</strong> <strong>Poverty</strong> <strong>Capital</strong><br />
2016 Toronto <strong>Child</strong> and Family <strong>Poverty</strong> Report Card<br />
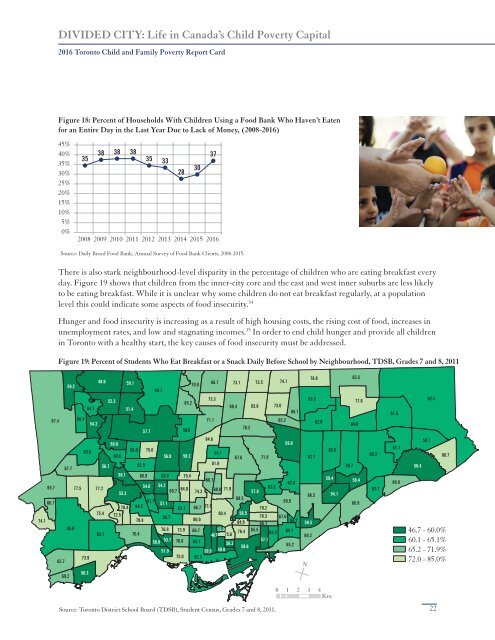
Figure 18: Percent of Households With <strong>Child</strong>ren Using a Food Bank Who Haven’t Eaten<br />
for an Entire Day in the Last Year Due to Lack of Money, (2008-2016)<br />
45%<br />
40%<br />
35%<br />
30%<br />
25%<br />
20%<br />
15%<br />
10%<br />
5%<br />
0%<br />
38 38 38<br />
37<br />
35<br />
35 33<br />
30<br />
28<br />
2008 2009 2010 2011 2012 2013 2014 2015 2016<br />
Source: Daily Bread Food Bank, Annual Survey of Food Bank Clients, 2008-2015.<br />
There is also stark neighbourhood-level disparity in the percentage of children who are eating breakfast every<br />
day. Figure 19 shows that children from the inner-city core and the east and west inner suburbs are less likely<br />
to be eating breakfast. While it is unclear why some children do not eat breakfast regularly, at a population<br />
level this could indicate some aspects of food insecurity. 34<br />
Hunger and food insecurity is increasing as a result of high housing costs, the rising cost of food, increases in<br />
unemployment rates, and low and stagnating incomes. 35 <strong>In</strong> order to end child hunger and provide all children<br />
in Toronto with a healthy start, the key causes of food insecurity must be addressed.<br />
Figure 19: Percent of Students Who Eat Breakfast or a Snack Daily Before School by Neighbourhood, TDSB, Grades 7 and 8, 2011<br />
48.6 59.1<br />
74.1<br />
59.2<br />
70.8<br />
66.7 73.1 73.5<br />
64.7<br />
52.3<br />
73.3<br />
65.2<br />
83.8 73.0<br />
64.1<br />
68.4<br />
51.4<br />
68.7<br />
67.4 60.4<br />
71.1<br />
65.2<br />
54.2<br />
70.2<br />
57.7<br />
59.6<br />
84.6<br />
50.0<br />
59.0<br />
63.0<br />
65.0 75.0<br />
64.1<br />
60.6<br />
56.9 58.2<br />
67.6 71.9<br />
62.5<br />
81.9<br />
67.7<br />
56.7<br />
56.1 68.9 62.0 75.4<br />
66.7<br />
62.4<br />
65.7 77.5 77.2<br />
54.0 54.2<br />
84.0<br />
71.9<br />
62.6<br />
55.3<br />
69.7 74.3<br />
68.8<br />
57.8<br />
68.5<br />
66.7<br />
61.7<br />
69.9<br />
57.1<br />
78.4 64.5<br />
63.1 66.7 73.9<br />
79.2<br />
75.4 72.5<br />
80.4 56.5<br />
59.7<br />
78.3 67.6<br />
74.1<br />
79.8<br />
80.0<br />
84.9<br />
64.2<br />
66.7<br />
65.0<br />
76.9 73.9 66.7 55.0<br />
76.4 65.5<br />
64.1<br />
62.7<br />
70.4<br />
63.2<br />
46.7 75.6<br />
70.8 65.1<br />
57.1<br />
58.8<br />
53.7<br />
58.3<br />
59.6<br />
65.2<br />
51.0<br />
50.0 48.8<br />
73.9<br />
75.0 62.3<br />
65.7<br />
56.3<br />
69.2<br />
76.6<br />
63.5<br />
62.8<br />
62.1<br />
66.5<br />
59.5<br />
69.2<br />
N<br />
60.5<br />
59.4<br />
54.1<br />
65.5<br />
77.6<br />
64.0<br />
59.7<br />
58.4<br />
66.9<br />
60.3<br />
63.1<br />
61.9<br />
61.7<br />
68.9<br />
58.4<br />
59.7<br />
62.4<br />
80.7<br />
46.7 - 60.0%<br />
60.1 - 65.1%<br />
65.2 - 71.9%<br />
72.0 - 85.0%<br />
0 1 2 3 4<br />
Km<br />
Source: Toronto District School Board (TDSB), Student Census, Grades 7 and 8, 2011.<br />
22