Divided City Life In Canada's Child Poverty Capital

Create successful ePaper yourself
Turn your PDF publications into a flip-book with our unique Google optimized e-Paper software.
DIVIDED CITY: <strong>Life</strong> in Canada’s <strong>Child</strong> <strong>Poverty</strong> <strong>Capital</strong><br />
2016 Toronto <strong>Child</strong> and Family <strong>Poverty</strong> Report Card<br />
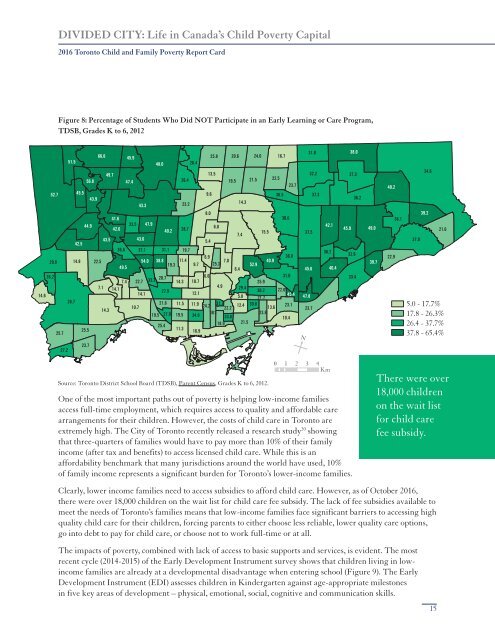
Figure 8: Percentage of Students Who Did NOT Participate in an Early Learning or Care Program,<br />
TDSB, Grades K to 6, 2012<br />
51.5<br />
66.6<br />
48.0<br />
26.4<br />
25.8 20.6<br />
49.7<br />
13.5<br />
32.2<br />
37.3<br />
47.4<br />
26.4<br />
21.5 22.5<br />
56.8<br />
19.5<br />
23.7<br />
52.7 45.5<br />
9.6<br />
36.5<br />
37.3<br />
43.9<br />
36.2<br />
14.3<br />
43.3<br />
23.2<br />
8.0<br />
41.6<br />
30.0<br />
44.9<br />
33.5 47.9<br />
42.1<br />
42.6<br />
45.9 49.0<br />
40.2<br />
28.7<br />
6.0<br />
15.5<br />
37.5<br />
7.4<br />
43.5<br />
43.6<br />
5.4<br />
42.5<br />
36.6 37.1 31.1 19.7<br />
36.2<br />
36.8<br />
32.6<br />
6.9<br />
29.0 14.8 22.5<br />
54.0 38.8 11.4<br />
7.0 40.9<br />
39.7<br />
19.3 9.7 25.3<br />
52.9<br />
49.5<br />
6.4<br />
45.6 40.4<br />
36.2<br />
20.7<br />
6.6<br />
31.0<br />
33.4<br />
7.4 22.7 33.3 14.3 10.7<br />
25.9<br />
7.1<br />
4.9<br />
14.1<br />
29.4<br />
27.9<br />
30.2 22.0<br />
14.6<br />
14.1<br />
12.1<br />
5.8<br />
45.4<br />
21.7<br />
47.8<br />
26.7<br />
21.6 11.5 11.9<br />
23.1<br />
10.7<br />
24.2 12.4 30.8<br />
14.3<br />
22.2<br />
13.6<br />
23.7<br />
19.5<br />
23.8<br />
19.5 27.0<br />
18.1<br />
34.0<br />
33.6<br />
10.4<br />
21.5<br />
25.4<br />
18.9<br />
25.5<br />
11.3<br />
25.7<br />
16.9<br />
27.2<br />
23.7<br />
45.9<br />
24.0<br />
16.7<br />
31.0<br />
31.7 5.0 - 17.7%<br />
17.8 - 26.3%<br />
26.4 - 37.7%<br />
37.8 - 65.4%<br />
N<br />
38.0<br />
40.2<br />
22.9<br />
36.1<br />
37.0<br />
34.6<br />
39.2<br />
21.6<br />
Source: Toronto District School Board (TDSB), Parent Census, Grades K to 6, 2012.<br />
0 1 2 3 4<br />
Km<br />
One of the most important paths out of poverty is helping low-income families<br />
access full-time employment, which requires access to quality and affordable care<br />
arrangements for their children. However, the costs of child care in Toronto are<br />
extremely high. The <strong>City</strong> of Toronto recently released a research study 20 showing<br />
that three-quarters of families would have to pay more than 10% of their family<br />
income (after tax and benefits) to access licensed child care. While this is an<br />
affordability benchmark that many jurisdictions around the world have used, 10%<br />
of family income represents a significant burden for Toronto’s lower-income families.<br />
There were over<br />
18,000 children<br />
on the wait list<br />
for child care<br />
fee subsidy.<br />
Clearly, lower income families need to access subsidies to afford child care. However, as of October 2016,<br />
there were over 18,000 children on the wait list for child care fee subsidy. The lack of fee subsidies available to<br />
meet the needs of Toronto’s families means that low-income families face significant barriers to accessing high<br />
quality child care for their children, forcing parents to either choose less reliable, lower quality care options,<br />
go into debt to pay for child care, or choose not to work full-time or at all.<br />
The impacts of poverty, combined with lack of access to basic supports and services, is evident. The most<br />
recent cycle (2014-2015) of the Early Development <strong>In</strong>strument survey shows that children living in lowincome<br />
families are already at a developmental disadvantage when entering school (Figure 9). The Early<br />
Development <strong>In</strong>strument (EDI) assesses children in Kindergarten against age-appropriate milestones<br />
in five key areas of development – physical, emotional, social, cognitive and communication skills.<br />
15