Divided City Life In Canada's Child Poverty Capital

Create successful ePaper yourself
Turn your PDF publications into a flip-book with our unique Google optimized e-Paper software.
DIVIDED CITY: <strong>Life</strong> in Canada’s <strong>Child</strong> <strong>Poverty</strong> <strong>Capital</strong><br />
2016 Toronto <strong>Child</strong> and Family <strong>Poverty</strong> Report Card<br />
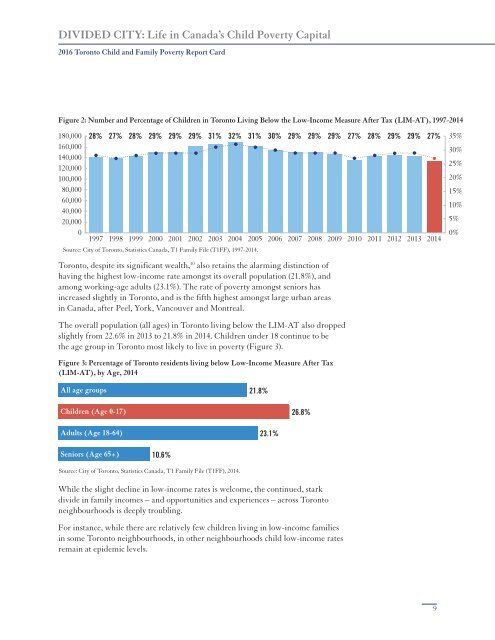
Figure 2: Number and Percentage of <strong>Child</strong>ren in Toronto Living Below the Low-<strong>In</strong>come Measure After Tax (LIM-AT), 1997-2014<br />
180,000<br />
160,000<br />
140,000<br />
120,000<br />
100,000<br />
80,000<br />
60,000<br />
40,000<br />
20,000<br />
0<br />
28% 27% 28% 29% 29% 29% 31% 32% 31% 30% 29% 29% 29% 27% 28% 29% 29% 27%<br />
1997 1998 1999 2000 2001 2002 2003 2004 2005 2006 2007 2008 2009 2010 2011 2012 2013 2014<br />
Source: <strong>City</strong> of Toronto, Statistics Canada, T1 Family File (T1FF), 1997-2014.<br />
35%<br />
30%<br />
25%<br />
20%<br />
15%<br />
10%<br />
5%<br />
0%<br />
Toronto, despite its significant wealth, 10 also retains the alarming distinction of<br />
having the highest low-income rate amongst its overall population (21.8%), and<br />
among working-age adults (23.1%). The rate of poverty amongst seniors has<br />
increased slightly in Toronto, and is the fifth highest amongst large urban areas<br />
in Canada, after Peel, York, Vancouver and Montreal.<br />
The overall population (all ages) in Toronto living below the LIM-AT also dropped<br />
slightly from 22.6% in 2013 to 21.8% in 2014. <strong>Child</strong>ren under 18 continue to be<br />
the age group in Toronto most likely to live in poverty (Figure 3).<br />
Figure 3: Percentage of Toronto residents living below Low-<strong>In</strong>come Measure After Tax<br />
(LIM-AT), by Age, 2014<br />
All age groups<br />
21.8%<br />
<strong>Child</strong>ren (Age 0-17)<br />
26.8%<br />
Adults (Age 18-64)<br />
23.1%<br />
Seniors (Age 65+)<br />
10.6%<br />
Source: <strong>City</strong> of Toronto, Statistics Canada, T1 Family File (T1FF), 2014.<br />
While the slight decline in low-income rates is welcome, the continued, stark<br />
divide in family incomes – and opportunities and experiences – across Toronto<br />
neighbourhoods is deeply troubling.<br />
For instance, while there are relatively few children living in low-income families<br />
in some Toronto neighbourhoods, in other neighbourhoods child low-income rates<br />
remain at epidemic levels.<br />
9