Daily Focus
P3U5306mr62
P3U5306mr62

You also want an ePaper? Increase the reach of your titles
YUMPU automatically turns print PDFs into web optimized ePapers that Google loves.
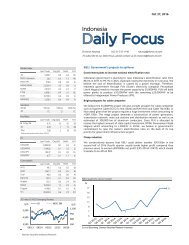
Nov 21, 2016<br />
Indonesia<br />
<strong>Daily</strong> <strong>Focus</strong><br />
Dang Maulida +62-21-515-1140 dangmaulida@dwsec-id.com<br />
To subscribe to our <strong>Daily</strong> <strong>Focus</strong>, please contact us at research@dwsec-id.com<br />
Market Index<br />
Last Trade Chg (%) MoM YoY<br />
JCI 5,170.1 -0.4 -4.0 13.8<br />
MSCI Indonesia 23.9 -0.7 -9.1 12.6<br />
MSCI EM 844.5 -0.3 -7.0 0.4<br />
HANG SENG 22,344.2 0.4 -4.8 -2.2<br />
KOSPI 1,974.6 -0.3 -2.9 -0.8<br />
FTSE 6,775.8 -0.3 -3.2 7.3<br />
DJIA 18,867.9 -0.2 4.2 6.1<br />
NASDAQ 5,321.5 -0.2 1.5 4.5<br />
Valuation<br />
2016F P/E (x) P/B (x) ROE (%)<br />
JCI 17.0 2.3 17.5<br />
Key Rates<br />
Last Trade Chg (bps) MoM YoY<br />
BI 7-Day RR 4.75 -25 -25 -50*<br />
3yr 7.51 4 68 -105<br />
10yr 7.76 1 65 -85<br />
*since introduced in Aug 2016<br />
FX<br />
Last Trade Chg (%) MoM YoY<br />
USD/IDR 13,428.00 0.4 2.7 -3.2<br />
USD/KRW 1,183.18 0.6 4.2 2.1<br />
USD/JPY 110.91 0.7 6.8 -9.7<br />
USD/CNY 6.89 0.0 2.0 7.7<br />
Commodities<br />
Last Trade Chg (%) MoM YoY<br />
WTI 45.7 0.6 -10.1 -5.7<br />
Gold 1,207.9 -0.7 -4.6 13.0<br />
Coal 40.0 0.0 0.0 -5.1<br />
Palm Oil 705.0 0.0 5.0 21.3<br />
Rubber 149.1 0.0 13.8 59.1<br />
Nickel 11,245.0 -0.8 8.0 25.2<br />
Copper 5,495.5 1.2 17.4 19.2<br />
Tin 20,200.0 0.0 2.9 38.4<br />
JCI Index VS MSCI Emerging Markets<br />
(pt) JCI MSCI EM (pt)<br />
5,500<br />
4,500<br />
1,100<br />
950<br />
800<br />
3,500<br />
650<br />
11/13 08/14 05/15 02/16 11/16<br />
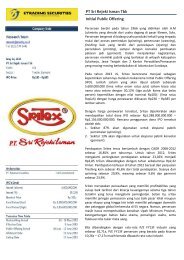
MERK: 9M16 review of stable growth<br />
9M16 performance<br />
MERCK (MERK) published its 9M16 res ults, with revenue of IDR707.3bn (+7%<br />
YoY) and IDR125.4bn in net profit (+3.2% YoY). Cost of goods sold (COGS)<br />
increased (at a lower rate) at 6.4% YoY and thus enabled MERK to slightly<br />
improve gross margin rate to 51.4% in 9M16 vs. 51.1% in 9M15. MERK incurred a<br />
11.9% YoY increase in selling expenses in 9M16; nevertheless total operating<br />
expenses were mitigated by miscellaneous income, and thus MERK was able to<br />
maintain operating margin of 20.8% in the period (vs. 20.7% in 9M15).<br />
3Q16 performance<br />
In 3Q16, MERK posted revenue of IDR229.4bn, slightly higher (+2.1% YoY)<br />
compared to 3Q15’s IDR224.6bn . Meanwhile, compared to 2Q16, MERK<br />
underwent a 15.7% decrease, which we attribute to the higher base in the<br />
previous quarter. MERK’s revenue growth in 3Q16 both on an annual and<br />
quarterly basis is lower compared to that of companies included in the LQ-45<br />
index. LQ-45 index constituents posted 5.0% YoY growth and -2.4% QoQ growth<br />
in 3Q16.<br />
Strength in revenue composition<br />
MERK is a debt-free company and has been operating in Indonesia for more than<br />
four decades, which will be another positive point to be able to grow with the<br />
country. Indonesia’s is a domestic-driven economy; between 2010-2015, private<br />
consumption took up at an average 55% of total gross domestic product. Figure 6<br />
shows that in 3Q16, private consumption gained more momentum growing at<br />
c.4% QoQ despite the high base effect from Idul Fitri in 2Q16.<br />
Private consumption in Indonesia GDP gained momentum (3Q16)<br />
1 ,3 2 0 .0<br />
1 ,3 0 0 .0<br />
1 ,2 8 0 .0<br />
1 ,2 6 0 .0<br />
1 ,2 4 0 .0<br />
1 ,2 2 0 .0<br />
1 ,2 0 0 .0<br />
1 ,1 8 0 .0<br />
1 ,1 6 0 .0<br />
1 ,1 4 0 .0<br />
1 ,1 2 0 .0<br />
( ID R t r)<br />
1 ,1 8 8 .7<br />
1 ,2 0 2 .8<br />
Source: BPS, Daewoo Securities Indonesia<br />
1 ,2 4 5 .3 1 ,2 4 5 .4 1 ,2 4 7 .8<br />
1 ,2 6 3 .7<br />
1 ,3 0 7 .7<br />
1 Q 1 5 2 Q 1 5 3 Q 1 5 4 Q 1 5 1 Q 1 6 2 Q 1 6 3 Q 1 6<br />
Daewoo Securities Indonesia Research<br />
(pt) JCI MSCI EM (pt)<br />
5,500<br />
1,100
Indonesia <strong>Daily</strong> <strong>Focus</strong><br />
Nov 21, 2016<br />
Local flash<br />
ADHI: Adhi Karya won contracts Mampang-Kuningan underpass. PT Adhi Karya<br />
(Persero) Tbk obtained a contract worth IDR202.21 billion of Mampang-Kuningan<br />
underpass construction project in Jakarta. Corporate Secretary of Adhi Karya Ki<br />
Syahgolang Permata explained that the owner of the project is Dinas Bina Marga<br />
Provinsi DKI Jakarta. The work scope of the project for Adhi Karya is a design and build)<br />
with a construction period of 392 days. (Bisnis Indonesia)<br />
HMSP: HM Sampoerna allocated a capex of IDR1 trillion next year. PT HM<br />
Sampoerna Tbk (HMSP) prepared a capital expenditure next year of about IDR1 trillion.<br />
It is relatively the same with the budget has been disbursed this year. "There is no<br />
expansion, just to support future business such as the production engine upgrade to<br />
increase capacity," said Senior Manager of Philip Morris International Inc. (PMI) Paul<br />
Janelle. The allocation is also expected to boost sales volume. (Kontan)<br />
KIJA: Jababeka and PP Properti establish a joint ventures to develop land. A<br />
subsidiary of PT Kawasan Industri Jababeka Tbk (KIJA), PT Grahabuana Cikarang has<br />
set up a joint venture with PT PP Properti Tbk (PPRO). According to Budianto Liman,<br />
Director of KIJA, the joint venture company named PT PP Properti Jababeka Residen.<br />
The joint venture company has a paid up capital of IDR220.53 billion shares with PT PP<br />
Properti Tbk has 52.6% of ownership and PT Grahabuana Cikarang 47.5%. (Iqplus)<br />
BBYB: Asabri continue to add stake in Bank Yudha Bhakti. PT Asuransi Sosial<br />
Angkatan Bersenjata Republik Indonesia (Asabri) increased its interest in Bank Yudha<br />
Bhakti. Based on Bank Yudha Bakti information to the Indonesian Stock Exchange, the<br />
additional shares recorded at 400 million shares. So that on 16 November 2016,<br />
Asabri's shares in Bank Yudha Bhakti increase to 28.05% from 18.11%. (Iqplus)<br />
BSIM: Bank Sinarmas to maintain NPL ratio below 2% in 2017. PT Bank Sinarmas Tbk<br />
(BSIM) plans to restructure the loans in property sector and mining. This was done<br />
because of the swelling in the ratio of non performing loans (NPL). The company's<br />
gross NPLs increased to 3.45% from 2.27%. Director of BSIM Freenyan Liwang believe<br />
that through the restructuring, the credit quality will be better. (Iqplus)<br />
LTLS: Lautan Luas aiming for revenue growth of 15%. Distributors and manufacturers<br />
of chemicals PT Lautan Luas Tbk (LTLS) predicts that its revenue could grow by at least<br />
15% next year. This is because there are a number of new products that will be<br />
launched next year. "In addition to new products, LNK also start operating next year so<br />
that it could support our growth," said Managing Director LTLS Joshua Chandraputra<br />
Asali. Management predicts that the company will record a revenue of IDR7 trillion.<br />
Thus, at least LTLS targets revenue of IDR8 trillion. (Kontan)<br />
Daewoo Securities Indonesia Research<br />
2
Indonesia <strong>Daily</strong> <strong>Focus</strong><br />
Nov 21, 2016<br />
Summary<br />
Technical analysis<br />
Tasrul +62-21-515-1140 tasrul@dwsec-id.com<br />
Jakarta Composite Index (JCI) – Consolidation<br />
Item Data Item Data<br />
Close (Nov 18, 2016) 5,170(-0.4%)Trading range 5,140-5,232<br />
Average index performance (%)<br />
3.66Target<br />
Period 297 - <strong>Daily</strong> 5,229<br />
r-squared 0.8764 - Weekly 5,257<br />
Volatility (+/-, %) 0.52 - Monthly 5,283<br />
Volatility (+/-, point) 26.95Stop loss 5,094<br />
Source: Daewoo Securities Indonesia Research<br />
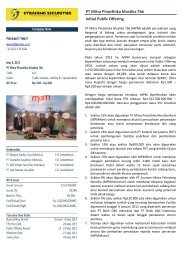
Figure 1. <strong>Daily</strong> trend - Uptrend<br />
^JKSE-<strong>Daily</strong>11/18/2016Open5195.08, Hi 5196.91, Lo5139.21, Close 5170.11(-0.4%)UpperBand=5,644.41, Channel_prd=5,448.22, Lower Band=5,252.03, UpperBand=5,756.18, Channel_prd=<br />
5,756.18<br />
5,644.41<br />
5,448.22<br />
5,448.22<br />
5,232<br />
5,140<br />
5,252.88<br />
5,252.03<br />
5,170.11<br />
5,140.27<br />
5,094.56<br />
Optimization Trading System - ©2010<br />
^JKSE-Volume =7,211,876,352.00, Avg.Volume =8,653,112,320.00<br />
Optimization Trading System - ©2010<br />
Aug Sep Oct Nov Dec 2016 Feb Mar Apr May Jun Jul Aug Sep Oct Nov<br />
Created with AmiBroker - advanced charting and technical analysis software. http://www.amibroker.com<br />
8,653,112,320<br />
7,211,876,352<br />
Source: Daewoo Securities Indonesia Research<br />
Daewoo Securities Indonesia Research<br />
3
Indonesia <strong>Daily</strong> <strong>Focus</strong><br />
Nov 21, 2016<br />
Figure 2. <strong>Daily</strong> MFI optimized & W%R optimized<br />
^JKSE-MFI Smoothed=58.60<br />
58.5959<br />
^JKSE-Will%RSmoothed=-70.96<br />
-70.9578<br />
^JKSE-<strong>Daily</strong>11/18/2016Open5195.08, Hi 5196.91, Lo5139.21, Close 5170.11(-0.4%)VWAP=5,094.56, VWAP=5,276.84<br />
5,232<br />
5,140<br />
5,276.84<br />
5,170.11<br />
5,094.56<br />
Optimization Trading System - ©2010<br />
^JKSE-Volume =7,211,876,352.00, Avg.Volume =8,809,157,632.00<br />
Optimization Trading System - ©2010<br />
Dec 2016 Feb Mar Apr May Jun Jul Aug Sep Oct Nov<br />
Created with AmiBroker - advanced charting and technical analysis software. http://www.amibroker.com<br />
8,809,157,632<br />
7,211,876,352<br />
Source: Daewoo Securities Indonesia Research<br />
Figure 3. <strong>Daily</strong>, target : 5,229 Figure 4. Weekly, target : 5,257 Figure 5. Monthly,target : 5,283<br />
^ J K S E - D a i l y 1 1 / 1 8 / 2 0 1 6 O p e n 5 1 9 5 . 0 8 , H i 5 1 9 6 . 9 1 , L o 5 1 3 9 . 2 1 ,<br />
^ J K S E - W e e k l y 1 1 / 1 8 / 2 0 1 6 O p e n 5 1 9 4 . 9 3 , H i 5 2 0 2 . 3 1 , L o<br />
^ J K S E - M o n th ly 1 1 /1 8 /2 0 1 6 O p e n 5 4 3 0 .7 5 , H i 5 4 9 1 .7 , L o<br />
x<br />
5 ,6 0 5 .8 1<br />
5 ,5 2 5 .3 5<br />
5 ,4 4 4 .8 9<br />
5 , 2 2 9 . 2 3<br />
5 , 2 1 5 . 7 5<br />
5 , 2 0 2 . 2 8<br />
5 , 1 8 8 . 8<br />
5 , 1 7 5 . 3 2<br />
5 , 1 7 0 . 1 1<br />
5 , 1 6 1 . 8 5<br />
5 , 1 4 8 . 3 7<br />
5 , 1 3 4 . 9<br />
5 , 1 2 1 . 4 2<br />
5 , 2 9 2 . 8 2<br />
5 , 2 5 7 . 7 8<br />
5 , 2 2 2 . 7 5<br />
5 , 1 8 7 . 7 1<br />
5 , 1 7 0 . 1 1<br />
5 , 1 5 2 . 6 8<br />
5 , 1 1 7 . 6 4<br />
5 , 0 8 2 . 6<br />
5 , 0 4 7 . 5 7<br />
5 , 0 1 2 . 5 3<br />
5 ,3 6 4 .4 3<br />
5 ,2 8 3 .9 8<br />
5 ,2 0 3 .5 2<br />
5 ,1 7 0 .1 1<br />
5 ,1 2 3 .0 6<br />
5 ,0 4 2 .6<br />
4 ,9 6 2 .1 5<br />
^ J K S E - V o l u m e = 7 , 2 1 1 , 8 7 6 , 3 5 2 . 0 0 , A v g . V o l u m e = 8 , 8 0 9 , 1 5 7 , 6 3 2 . 0 0<br />
^ J K S E - V o l u m e = 3 9 , 6 7 5 , 7 7 2 , 9 2 8 . 0 0 , A v g . V o l u m e = 3 9 , 7 6 1 , 8 9 9 , 5 2 0 . 0 0<br />
^ J K S E - V o lu m e = 1 1 8 ,8 5 7 ,2 6 9 ,2 4 8 .0 0 , A v g .V o lu m e = 1 1 6 ,2 1 5 ,3 2 4 ,6 7 2 .0 0<br />
8 , 8 0 9 , 1 5 7 , 6 3 2<br />
7 , 2 1 1 , 8 7 6 , 3 5 2<br />
O p ti m i z a ti o n T ra d i n g S y ste m - © 2 0 1 0<br />
O c t<br />
N o v<br />
Cr e a te d w ith A m iB r o ke r - a d v a n c e d c h a r tin g a n d te c h n ic a l a n a ly s is s o f tw a r e . h ttp ://w w w .a m ib r o ke r .c o m<br />
3 9 , 7 6 1 , 8 9 9 , 5 2 0<br />
3 9 , 6 7 5 , 7 7 2 , 9 2 8<br />
O p tim iz a ti o n T ra d i n g S y ste m - © 2 0 1 0<br />
A p r J u l O c t<br />
Cr e a te d w ith A miB r o ke r - a d v a n c e d c h a r tin g a n d te c h n ic a l a n a ly s is s o f tw a r e . h ttp ://w w w .a mib r o ke r .c o m<br />
1 1 8 ,8 5 7 ,2 6 9 ,2 4 8<br />
1 1 6 ,2 1 5 ,3 2 4 ,6 7 2<br />
O p tim iz a tio n T ra d in g S y ste m - © 2 0 1 0<br />
2 0 1 4 2 0 1 5 2 0 1 6<br />
Cr e a te d w ith A miB r o ke r - a d v a n c e d c h a r tin g a n d te c h n ic a l a n a ly s is s o f tw a r e . h ttp ://w w w .a mib r o ke r .c o m<br />
Source: Daewoo Securities Indonesia Research Source: Daewoo Securities Indonesia Research Source: Daewoo Securities Indonesia Research<br />
Daewoo Securities Indonesia Research<br />
4
Indonesia <strong>Daily</strong> <strong>Focus</strong><br />
Nov 21, 2016<br />
Chart 6. JCI Vs. USD/IDR<br />
(pt) JCI (L) USD/IDR (R)<br />
5,700<br />
5,500<br />
5,300<br />
5,100<br />
4,900<br />
4,700<br />
4,500<br />
4,300<br />
8/22 9/5 9/19 10/3 10/17 10/31 11/14<br />
Source: Bloomberg, Daewoo Securities Indonesia Research<br />
(IDR)<br />
14,000<br />
13,800<br />
13,600<br />
13,400<br />
13,200<br />
13,000<br />
12,800<br />
Chart 7. JCI performance (absolute vs. relative)<br />
(%, %p)<br />
16<br />
12<br />
8<br />
4<br />
0<br />
-4<br />
-8<br />
-0.4 -0.1<br />
-1.2 -0.6<br />
Note: Relative to MSCI EM Index<br />
Source: Bloomberg, Daewoo Securities Indonesia Research<br />
-4.4<br />
Absolute<br />
2.9<br />
13.313.2<br />
1D 1W 1M 1Y<br />
Relative<br />
Chart 8. Foreigner’s net purchase (EM)<br />
Chart 9. Energy price<br />
(USDmn)<br />
0<br />
0<br />
-200 -145<br />
-400<br />
-600<br />
-202<br />
1 Day 5 Days<br />
-10 -21 -17<br />
-105 -140<br />
-236 -295<br />
((D-3M=100)<br />
190<br />
170<br />
150<br />
CPO WTI Coal<br />
-800<br />
130<br />
-1,000<br />
-1,200<br />
-1,400<br />
-1,081<br />
110<br />
90<br />
-1,600<br />
-1,501<br />
Korea Taiwan Indonesia ThailandPhilippines India<br />
70<br />
8/16 9/16 9/16 10/16 10/16 10/16 11/16<br />
Note: The latest figure for India are Nov, 17 th<br />
Source: Bloomberg, Daewoo Securities Indonesia Research<br />
Source: Bloomberg, Daewoo Securities Indonesia Research<br />
Chart 10. Non-ferrous metal price<br />
Chart 11. Precious metal price<br />
((D-3M=100) Copper Nickel Tin<br />
120<br />
110<br />
100<br />
90<br />
110<br />
105<br />
100<br />
95<br />
90<br />
85<br />
80<br />
75<br />
Silver Gold Platinum<br />
80<br />
8/16 9/16 9/16 10/16 10/16 10/16 11/16<br />
Source: Bloomberg, Daewoo Securities Indonesia Research<br />
70<br />
8/16 9/16 9/16 10/16 10/16 10/16 11/16<br />
Source: Bloomberg, Daewoo Securities Indonesia Research<br />
Daewoo Securities Indonesia Research<br />
5
Indonesia <strong>Daily</strong> <strong>Focus</strong><br />
Nov 21, 2016<br />
Table. Key valuation metrics<br />
Company Name<br />
Ticker<br />
Price Market Cap Price Performance (%) P/E(X)* P/B(X)* ROE(%)*<br />
(IDR) (IDRbn) 1D 1W 1M 1Y FY16 FY17 FY16 FY17 FY16 FY17<br />
Jakarta Composite Index JCI 5,170 5,613,631 -0.4 -1.2 -4.8 14.9 16.8 14.1 2.3 2.1 17.8 17.5<br />
FINANCIALS<br />
Bank Central Asia BBCA 14,725 363,045 -0.2 0.3 -8.3 12.6 16.3 14.5 2.9 2.5 18.7 18.1<br />
Bank Mandiri Persero BMRI 10,925 254,917 0.2 0.7 -4.2 26.7 11.8 10.3 1.6 1.4 13.9 14.3<br />
Bank Rakyat Indonesia Persero BBRI 11,500 283,695 0.0 -4.0 -5.7 5.0 9.8 8.7 1.8 1.6 19.0 18.7<br />
Bank Negara Indonesia Persero BBNI 5,225 97,439 0.0 1.5 -3.2 4.0 7.7 6.6 1.0 0.9 13.8 14.7<br />
Bank Tabungan Negara Persero BBTN 1,660 17,579 -1.2 -5.7 -13.5 37.2 9.3 8.1 0.9 0.8 9.5 10.2<br />
CONSUMER<br />
HM Sampoerna HMSP 3,800 442,009 0.5 -0.5 -8.0 2.2 33.1 29.5 12.0 10.7 36.9 38.6<br />
Gudang Garam GGRM 63,100 121,410 0.2 -1.6 -4.6 27.4 16.0 14.0 2.7 2.4 17.7 17.9<br />
Indofood CBP Sukses Makmur ICBP 9,100 106,123 0.0 3.7 -4.5 42.7 26.1 23.2 5.4 4.9 21.6 21.7<br />
Indofood Sukses Makmur INDF 7,775 68,268 -0.6 1.3 -10.1 44.0 15.2 13.3 2.1 1.9 14.6 15.2<br />
Kalbe Farma KLBF 1,465 68,672 -1.0 -4.6 -15.6 8.5 26.6 23.9 5.2 4.7 20.2 20.7<br />
Unilever Indonesia UNVR 40,250 307,108 -0.6 -1.8 -9.5 10.2 42.2 37.4 52.5 48.5 130.5 137.5<br />
AGRICULTURAL<br />
Astra Agro Lestari AALI 15,200 29,255 -1.9 -3.3 -4.7 -12.0 15.7 12.8 1.7 1.5 11.0 12.0<br />
PP London Sumatera Indonesia LSIP 1,600 10,917 -2.4 2.2 0.9 27.5 15.4 13.3 1.4 1.3 8.7 9.5<br />
Sawit Sumbermas Sarana SSMS 1,390 13,240 -3.1 -5.1 -4.8 -16.3 16.1 11.0 3.2 2.7 21.3 22.0<br />
INFRASTRUCTURE<br />
XL Axiata EXCL 2,340 25,010 -1.7 -2.5 -3.3 -32.3 30.5 17.1 1.2 1.0 1.9 3.9<br />
Jasa Marga JSMR 4,270 29,036 -0.7 -6.2 -7.0 -12.5 17.5 19.1 2.3 2.1 12.4 11.1<br />
Perusahaan Gas Negara PGAS 2,390 57,937 -0.8 0.8 -7.0 -17.9 10.5 9.9 1.2 1.1 12.5 11.7<br />
Tower Bersama Infrastructure TBIG 5,675 27,220 1.8 0.9 -7.0 -12.7 17.8 15.0 6.8 5.2 43.1 38.0<br />
Telekomunikasi Indonesia TLKM 3,970 400,176 -0.8 0.3 -6.1 39.9 17.0 15.5 4.1 3.7 23.9 24.2<br />
Soechi Lines SOCI 394 2,781 0.0 -3.9 -5.3 -1.5 N/A N/A N/A N/A N/A N/A<br />
Garuda Indonesia GIAA 332 8,588 -0.6 -3.5 -16.2 10.3 17.8 12.2 2.3 2.0 11.5 15.1<br />
BASIC-INDUSTRIES<br />
Semen Indonesia SMGR 8,425 49,973 0.9 -4.8 -16.2 -26.7 11.4 10.3 1.6 1.5 14.3 14.7<br />
Charoen Pokphand Indonesia CPIN 3,340 54,769 -1.8 4.7 -9.7 20.4 15.5 13.0 3.2 2.7 21.4 21.8<br />
Indocement Tunggal Prakarsa INTP 14,900 54,850 0.7 -2.0 -11.7 -28.7 13.7 12.3 1.9 1.8 14.3 15.1<br />
Japfa Comfeed Indonesia JPFA 1,750 19,968 -3.8 0.3 0.0 361.7 10.7 9.1 2.0 1.7 21.0 20.1<br />
MINING<br />
Indo Tambangraya Megah ITMG 14,725 16,638 -4.1 -18.2 9.1 98.3 9.7 8.8 1.4 1.3 14.2 15.2<br />
Adaro Energy ADRO 1,500 47,979 -1.0 -9.6 4.2 160.9 11.2 11.2 1.1 1.1 8.8 9.2<br />
Aneka Tambang ANTM 900 21,628 0.0 0.0 8.4 192.2 N/A 31.2 1.2 1.3 0.6 3.2<br />
Vale Indonesia INCO 3,110 30,902 -2.8 -11.1 7.6 72.3 46.3 29.0 1.2 1.2 2.3 4.7<br />
Tambang Batubara Bukit Asam PTBA 11,125 25,633 -6.7 -18.2 -8.8 81.6 9.5 9.7 2.1 1.8 21.0 19.7<br />
TRADE<br />
United Tractors UNTR 21,300 79,452 -2.7 -6.8 7.6 24.9 14.8 13.6 1.8 1.7 12.6 12.8<br />
AKR Corporindo AKRA 6,975 27,843 1.1 6.9 2.2 18.2 21.7 18.9 3.6 3.2 17.4 17.7<br />
Global Mediacom BMTR 645 9,158 -2.3 -10.4 -24.1 -23.2 N/A N/A N/A N/A N/A N/A<br />
Matahari Department Store LPPF 15,200 44,352 -1.5 -4.1 -20.4 -0.8 18.0 16.1 15.3 11.9 96.9 82.0<br />
Media Nusantara Citra MNCN 1,785 25,483 -1.9 -5.1 -15.0 10.2 13.0 11.5 2.3 2.1 18.2 18.9<br />
Matahari Putra Prima MPPA 1,660 8,927 -0.9 -0.3 -10.5 -18.0 27.6 30.0 3.0 2.8 8.8 9.5<br />
Surya Citra Media SCMA 2,260 33,045 -3.8 -3.8 -14.1 -30.5 18.1 16.1 7.9 7.0 46.5 46.2<br />
Siloam International Hospital SILO 10,100 11,677 -0.7 0.0 -7.6 12.8 79.8 45.4 5.3 4.8 6.4 7.4<br />
PROPERTY<br />
Bumi Serpong Damai BSDE 1,825 35,125 0.3 -4.5 -18.2 11.6 13.6 11.9 1.5 1.3 11.5 12.1<br />
Adhi Karya ADHI 1,990 7,086 -0.5 -7.0 -15.7 -8.3 9.2 7.1 1.1 0.9 12.5 14.3<br />
Alam Sutera Realty ASRI 386 7,585 0.5 -4.0 -17.5 18.8 8.5 5.9 1.0 0.8 11.6 14.8<br />
Ciputra Development CTRA 1,425 21,981 -1.7 -8.7 -10.9 13.3 15.8 12.5 2.1 1.9 14.6 15.3<br />
Lippo Karawaci LPKR 800 18,462 -0.6 -7.0 -14.0 -31.3 13.0 11.8 1.0 0.9 8.7 8.8<br />
Pembangunan Perumahan PTPP 4,060 19,660 0.2 -1.0 -3.3 7.4 16.1 12.6 3.2 2.7 21.4 22.7<br />
Pakuwon Jati PWON 685 32,989 0.0 -0.7 -3.5 58.2 14.7 11.6 3.1 2.5 22.7 23.9<br />
Summarecon Agung SMRA 1,350 19,476 0.0 -1.8 -23.1 -4.6 28.8 22.6 2.7 2.6 9.7 11.4<br />
Wijaya Karya WIKA 2,360 14,938 0.0 -8.5 -7.0 -9.0 16.9 13.9 2.2 2.0 14.0 15.5<br />
Waskita Karya WSKT 2,320 31,490 0.4 -3.7 -12.1 38.9 15.8 11.9 2.3 1.9 17.0 17.7<br />
MISCELLANEOUS<br />
Astra International ASII 7,850 317,796 0.0 1.9 -7.4 23.6 16.8 15.2 2.6 2.4 15.6 15.6<br />
Source: Bloomberg, Daewoo Securities Indonesia Research<br />
*Note: Valuation metrics based on Bloomberg consensus estimates<br />
Daewoo Securities Indonesia Research<br />
6
Indonesia <strong>Daily</strong> <strong>Focus</strong><br />
Nov 21, 2016<br />
Sector performance<br />
Top 10 market cap performance<br />
Name Index Chg (%) Ticker Price Market Cap (IDRbn) Chg (%)<br />
Agricultural 1,767.6 -1.3 KRAS IJ 745 12,538 5.77<br />
Mining 1,318.7 -1.9 SMBR IJ 2400 23,610 3.00<br />
Basic-Industry 524.0 0.2 BISI IJ 1765 5,295 2.62<br />
Miscellaneous Industry 1,314.1 0.2 BBKP IJ 630 5,725 2.44<br />
Consumer Goods 2,324.3 -0.1 INKP IJ 1000 5,471 2.0<br />
Property & Construction 525.7 -0.2 JRPT IJ 840 11,550 1.82<br />
Infrastructure 1,045.8 -0.7 TBIG IJ 5675 27,220 1.79<br />
Finance 774.2 -0.1 BDMN IJ 3480 33,355 1.75<br />
Trade 830.9 -1.8 SMCB IJ 900 6,897 1.7<br />
Composite 5,170.1 -0.4 MYRX IJ 136 10,706 1.49<br />
Source: Bloomberg<br />
Top 5 leading movers<br />
Top 5 lagging movers<br />
Name Chg (%) Close Name Chg (%) Close<br />
HMSP IJ 0.5 3,800 TLKM IJ -0.8 3,970<br />
SMBR IJ 3.0 2,400 UNTR IJ -2.7 21,300<br />
BRAM IJ 20.0 9,000 UNVR IJ -0.6 40,250<br />
KRAS IJ 5.8 745 PTBA IJ -6.7 11,125<br />
BMRI IJ 0.2 10,925 AMRT IJ -6.5 505<br />
Source: Bloomberg<br />
Economic Calendar<br />
Time Currency Detail Forecast Previous<br />
6:50am JPY Trade Balance 0.35T<br />
9:00am NZD Credit Card Spending y/y 8.2%<br />
11:30am JPY All Industries Activity m/m 0.2%<br />
Tentative EUR German Buba Monthly Report<br />
8:30pm CAD Wholesale Sales m/m 0.8%<br />
9:00pm CNY CB Leading Index m/m 1.1%<br />
10:30pm AUD CB Leading Index m/m 0.0%<br />
11:00pm EUR ECB President Draghi Speaks<br />
Note: Time is based on Indonesian local time<br />
Source: Forex Factory<br />
Disclaimers<br />
This report is prepared strictly for private circulation only to clients of PT Daewoo Securities Indonesia (DWS). It is purpo sed only to person having<br />
professional experience in matters relating to investments. The information contained in this report has been taken from sources which we deem reliable. No<br />
warranty (express or implied) is made to the accuracy or completeness of the information. All opinions and estimates included in this report constitute our<br />
judgments as of this date, without regards to its fairness, and are subject to change without notice. However, none of DWS and/or its affiliated companies<br />
and/or their respective employees and/or agents makes any representation or warranty (express or implied) or accepts any responsibility or liability as to, or<br />
in relation to, the accuracy or completeness of the information and opinions contained in this report or as to any information contained in this report or any<br />
other such information or opinions remaining unchanged after the issue thereof. We expressly disclaim any responsibility or liability (express or implied) of<br />
DWS, its affiliated companies and their respective employees and agents whatsoever and howsoever arising (including, without limitation for any claims,<br />
proceedings, action, suits, losses, expenses, damages or costs) which may be brought against or suffered by any person as a results of acting in reliance upon<br />
the whole or any part of the contents of this report and neither DWS, its affiliated companies or their respective employees or agents accepts liability for any<br />
errors, omissions or misstatements, negligent or otherwise, in the report and any liability in respect of the report or any inaccuracy therein or omission there<br />
from which might otherwise arise is hereby expresses disclaimed.<br />
This document is not an offer to sell or a solicitation to buy any securities. This firms and its affiliates and their officers and employees may have a position,<br />
make markets, act as principal or engage in transaction in securities or related investments of any company mentioned herein, may perform services for or<br />
solicit business from any company mentioned herein, and may have acted upon or used any of the recommendations herein before they have been provided<br />
to you. © PT Daewoo Securities Indonesia 2015.<br />
Daewoo Securities Indonesia Research<br />
7