

2016 ET CARBON RANKINGS REPORT
2gIpuBS
2gIpuBS

Create successful ePaper yourself
Turn your PDF publications into a flip-book with our unique Google optimized e-Paper software.
14<br />
UNDERSTANDING THE <strong>ET</strong> <strong>CARBON</strong><br />
<strong>RANKINGS</strong>: SECTOR BREAKDOWN<br />
The <strong>2016</strong> <strong>ET</strong> Carbon Rankings measure<br />
the carbon efficiency of the world’s largest<br />
2,000 listed companies, making up 85% of<br />
global stock market value. They account<br />
for approximately $45 trillion in market<br />
capitalisation and approximately 9.5 billion<br />
tonnes of CO2 in direct emissions, an<br />
amount that exceeds the combined total<br />
emissions of the United States, Canada and<br />
the European Union.<br />
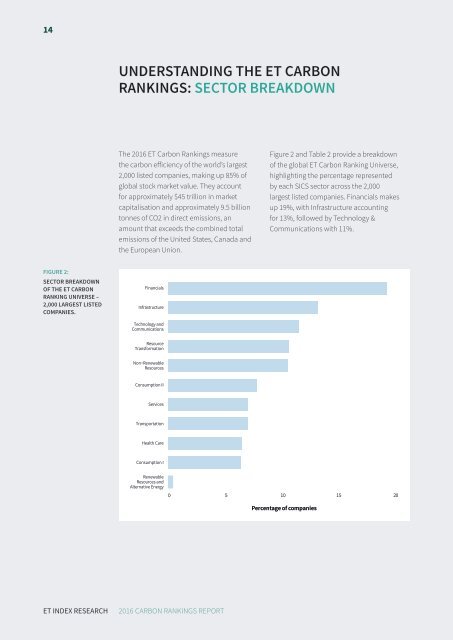
Figure 2 and Table 2 provide a breakdown<br />
of the global <strong>ET</strong> Carbon Ranking Universe,<br />
highlighting the percentage represented<br />
by each SICS sector across the 2,000<br />
largest listed companies. Financials makes<br />
up 19%, with Infrastructure accounting<br />
for 13%, followed by Technology &<br />
Communications with 11%.<br />
FIGURE 2:<br />
SECTOR BREAKDOWN<br />
OF THE <strong>ET</strong> <strong>CARBON</strong><br />
RANKING UNIVERSE –<br />
2,000 LARGEST LISTED<br />
COMPANIES.<br />
Financials<br />
Infrastructure<br />
Technology and<br />
Communications<br />
Resource<br />
Transformation<br />
Non−Renewable<br />
Resources<br />
Consumption II<br />
Services<br />
Transportation<br />
Health Care<br />
Consumption I<br />
Renewable<br />
Resources and<br />
Alternative Energy<br />
0 5 10 15 20<br />
Percentage of companies<br />
<strong>ET</strong> INDEX RESEARCH<br />
<strong>2016</strong> <strong>CARBON</strong> <strong>RANKINGS</strong> <strong>REPORT</strong>