

2016 ET CARBON RANKINGS REPORT
2gIpuBS
2gIpuBS

Create successful ePaper yourself
Turn your PDF publications into a flip-book with our unique Google optimized e-Paper software.
22<br />
UNDERSTANDING THE <strong>ET</strong> <strong>CARBON</strong> <strong>RANKINGS</strong><br />
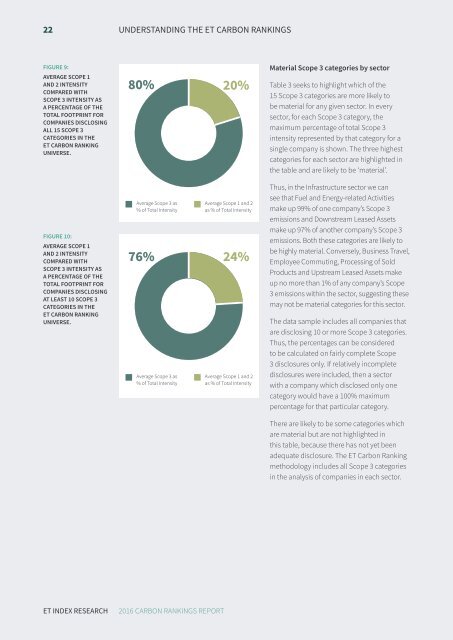
FIGURE 9:<br />
AVERAGE SCOPE 1<br />
AND 2 INTENSITY<br />
COMPARED WITH<br />
SCOPE 3 INTENSITY AS<br />
A PERCENTAGE OF THE<br />
TOTAL FOOTPRINT FOR<br />
COMPANIES DISCLOSING<br />
ALL 15 SCOPE 3<br />
CATEGORIES IN THE<br />
<strong>ET</strong> <strong>CARBON</strong> RANKING<br />
UNIVERSE.<br />
80%<br />
20%<br />
Material Scope 3 categories by sector<br />
Table 3 seeks to highlight which of the<br />
15 Scope 3 categories are more likely to<br />
be material for any given sector. In every<br />
sector, for each Scope 3 category, the<br />
maximum percentage of total Scope 3<br />
intensity represented by that category for a<br />
single company is shown. The three highest<br />
categories for each sector are highlighted in<br />
the table and are likely to be ‘material’.<br />
FIGURE 10:<br />
AVERAGE SCOPE 1<br />
AND 2 INTENSITY<br />
COMPARED WITH<br />
SCOPE 3 INTENSITY AS<br />
A PERCENTAGE OF THE<br />
TOTAL FOOTPRINT FOR<br />
COMPANIES DISCLOSING<br />
AT LEAST 10 SCOPE 3<br />
CATEGORIES IN THE<br />
<strong>ET</strong> <strong>CARBON</strong> RANKING<br />
UNIVERSE.<br />
Average Scope 3 as<br />
% of Total Intensity<br />
76%<br />
Average Scope 3 as<br />
% of Total Intensity<br />
Average Scope 1 and 2<br />
as % of Total Intensity<br />
24%<br />
Average Scope 1 and 2<br />
as % of Total Intensity<br />
Thus, in the Infrastructure sector we can<br />
see that Fuel and Energy-related Activities<br />
make up 99% of one company’s Scope 3<br />
emissions and Downstream Leased Assets<br />
make up 97% of another company’s Scope 3<br />
emissions. Both these categories are likely to<br />
be highly material. Conversely, Business Travel,<br />
Employee Commuting, Processing of Sold<br />
Products and Upstream Leased Assets make<br />
up no more than 1% of any company’s Scope<br />
3 emissions within the sector, suggesting these<br />
may not be material categories for this sector.<br />
The data sample includes all companies that<br />
are disclosing 10 or more Scope 3 categories.<br />
Thus, the percentages can be considered<br />
to be calculated on fairly complete Scope<br />
3 disclosures only. If relatively incomplete<br />
disclosures were included, then a sector<br />
with a company which disclosed only one<br />
category would have a 100% maximum<br />
percentage for that particular category.<br />
There are likely to be some categories which<br />
are material but are not highlighted in<br />
this table, because there has not yet been<br />
adequate disclosure. The <strong>ET</strong> Carbon Ranking<br />
methodology includes all Scope 3 categories<br />
in the analysis of companies in each sector.<br />
<strong>ET</strong> INDEX RESEARCH<br />
<strong>2016</strong> <strong>CARBON</strong> <strong>RANKINGS</strong> <strong>REPORT</strong>