

2016 ET CARBON RANKINGS REPORT
2gIpuBS
2gIpuBS

Create successful ePaper yourself
Turn your PDF publications into a flip-book with our unique Google optimized e-Paper software.
26<br />
<strong>CARBON</strong> REDUCTION POTENTIAL<br />
Non-Renewable Resources is the second<br />
most carbon-intensive SICS sector. If the least<br />
carbon-efficient companies achieved the<br />
median level it would cut sector emissions<br />
by 28%, saving 483 million tonnes of carbon<br />
dioxide a year, roughly equivalent to the<br />
annual emissions of Saudi Arabia. 30 Royal<br />
Dutch Shell, Siam Cement and Rio Tinto are<br />
among 31 companies disclosing complete<br />
data in this sector.<br />
The Resource Transformation sector has<br />
the potential to achieve the third greatest<br />
savings in emissions and the greatest<br />
percentage reduction. If the least carbonefficient<br />
companies achieved the median<br />
level it would cut sector emissions by 54%,<br />
saving 193 million tonnes of carbon dioxide a<br />
year, half the annual emissions of Australia. 31<br />
Mitsubishi Electric Corp, Siemens and General<br />
Electric are among 46 companies disclosing<br />
complete data in this sector.<br />
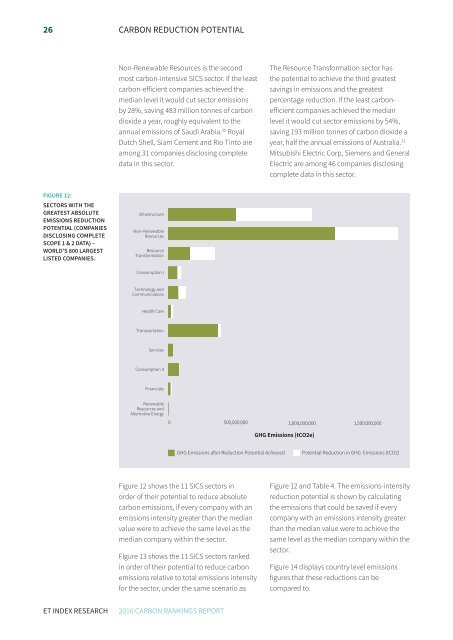
FIGURE 12:<br />
SECTORS WITH THE<br />
GREATEST ABSOLUTE<br />
EMISSIONS REDUCTION<br />
POTENTIAL (COMPANIES<br />
DISCLOSING COMPL<strong>ET</strong>E<br />
SCOPE 1 & 2 DATA) –<br />
WORLD’S 800 LARGEST<br />
LISTED COMPANIES.<br />
Infrastructure<br />
Non−Renewable<br />
Resources<br />
Resource<br />
Transformation<br />
Consumption I<br />
Technology and<br />
Communications<br />
Health Care<br />
Transportation<br />
Services<br />
Consumption II<br />
Financials<br />
Renewable<br />
Resources and<br />
Alternative Energy<br />
0 500,000,000 1,000,000,000 1,500,000,000<br />
GHG Emissions (tCO2e)<br />
GHG Emissions after Reduction Potential Achieved<br />
Potential Reduction in GHG Emissions (tCO2)<br />
Figure 12 shows the 11 SICS sectors in<br />
order of their potential to reduce absolute<br />
carbon emissions, if every company with an<br />
emissions intensity greater than the median<br />
value were to achieve the same level as the<br />
median company within the sector.<br />
FIgure 13 shows the 11 SICS sectors ranked<br />
in order of their potential to reduce carbon<br />
emissions relative to total emissions intensity<br />
for the sector, under the same scenario as<br />
Figure 12 and Table 4. The emissions-intensity<br />
reduction potential is shown by calculating<br />
the emissions that could be saved if every<br />
company with an emissions intensity greater<br />
than the median value were to achieve the<br />
same level as the median company within the<br />
sector.<br />
Figure 14 displays country level emissions<br />
figures that these reductions can be<br />
compared to.<br />
<strong>ET</strong> INDEX RESEARCH<br />
<strong>2016</strong> <strong>CARBON</strong> <strong>RANKINGS</strong> <strong>REPORT</strong>