

2016 ET CARBON RANKINGS REPORT
2gIpuBS
2gIpuBS

You also want an ePaper? Increase the reach of your titles
YUMPU automatically turns print PDFs into web optimized ePapers that Google loves.
24<br />
<strong>CARBON</strong> REDUCTION POTENTIAL:<br />
BENCHMARKING MEDIAN<br />
<strong>CARBON</strong> EFFICIENCY<br />
The <strong>ET</strong> Carbon Rankings are designed to<br />
encourage investors to shift investment to<br />
more carbon-efficient companies, reducing<br />
their own exposure to carbon risk and<br />
rewarding companies that take action<br />
and disclose it. This is intended to drive<br />
decarbonisation across the economy, by<br />
incentivising each company to become more<br />
carbon-efficient.<br />
The <strong>ET</strong> Low Carbon Index Series, which is<br />
based on the <strong>ET</strong> Carbon Rankings, weights<br />
investment towards the 50% of companies<br />
that are less carbon-intensive and away from<br />
the 50% that are more carbon-intensive. Thus,<br />
the Index Series rewards companies that<br />
achieve greater than median carbon efficiency.<br />
In this section, the median carbon-efficiency<br />
is used as a benchmark to get a sense of the<br />
carbon reduction potential associated with<br />
this approach (see Figure 11).<br />
Analysis of just the 363 companies that have<br />
disclosed complete Scope 1 and 2 emissions<br />
in the <strong>ET</strong> Global 800 reveals that in each<br />
sector, if the 50% which are more carbonintensive<br />
were to achieve the median level<br />
of carbon efficiency, it would save 1.4 billion<br />
tonnes of carbon dioxide a year, equivalent<br />
to the emissions of Japan, the world’s third<br />
largest economy. 26<br />
Further analysis reveals that 86% of these<br />
savings – 1.2 billion tonnes of carbon dioxide,<br />
equivalent to twice the emissions of South<br />
Korea – could be made by companies in just<br />
five industries: Electric Utilities; Oil and Gas<br />
Exploration and Production; Construction<br />
Materials; Chemicals; and Real Estate Owners,<br />
Developers and Investment Trusts. 27<br />
This analysis only looks at those companies<br />
that have disclosed complete Scope 1 and 2<br />
emissions, and does not consider the impact<br />
of Scope 3 emissions which typically account<br />
for 75% of companies’ total emissions. It is<br />
safe to assume that far greater savings could<br />
be made if the world’s largest companies took<br />
action to increase their carbon efficiency to<br />
the median level in their sector across the full<br />
range of their direct and value chain emissions.<br />
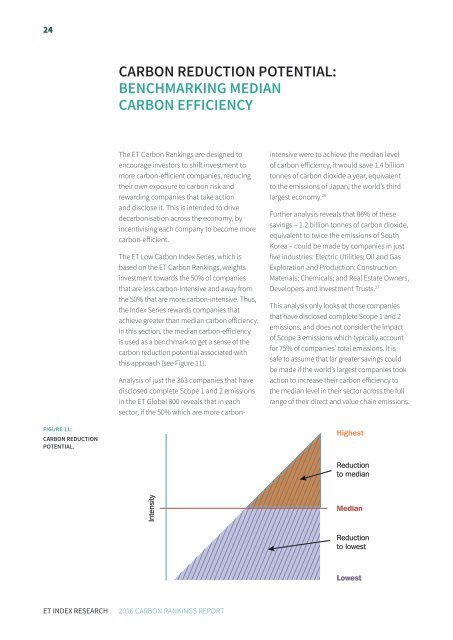
FIGURE 11:<br />
<strong>CARBON</strong> REDUCTION<br />
POTENTIAL.<br />
Highest<br />
Reduction<br />
to median<br />
Intensity<br />
Median<br />
Reduction<br />
to lowest<br />
Lowest<br />
<strong>ET</strong> INDEX RESEARCH<br />
<strong>2016</strong> <strong>CARBON</strong> <strong>RANKINGS</strong> <strong>REPORT</strong>