

2016 ET CARBON RANKINGS REPORT
2gIpuBS
2gIpuBS

You also want an ePaper? Increase the reach of your titles
YUMPU automatically turns print PDFs into web optimized ePapers that Google loves.
32<br />
<strong>CARBON</strong> REDUCTION POTENTIAL<br />
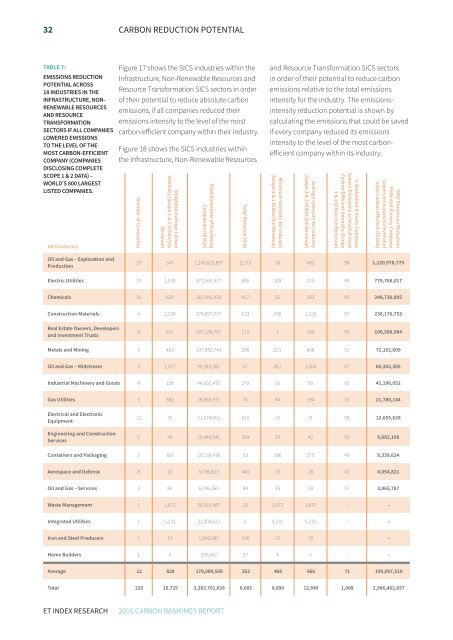
TABLE 7:<br />
EMISSIONS REDUCTION<br />
POTENTIAL ACROSS<br />
18 INDUSTRIES IN THE<br />
INFRASTRUCTURE, NON-<br />
RENEWABLE RESOURCES<br />
AND RESOURCE<br />
TRANSFORMATION<br />
SECTORS IF ALL COMPANIES<br />
LOWERED EMISSIONS<br />
TO THE LEVEL OF THE<br />
MOST <strong>CARBON</strong>-EFFICIENT<br />
COMPANY (COMPANIES<br />
DISCLOSING COMPL<strong>ET</strong>E<br />
SCOPE 1 & 2 DATA) –<br />
WORLD’S 800 LARGEST<br />
LISTED COMPANIES.<br />
SICS industry<br />
Figure 17 shows the SICS industries within the<br />
Infrastructure, Non-Renewable Resources and<br />
Resource Transformation SICS sectors in order<br />
of their potential to reduce absolute carbon<br />
emissions, if all companies reduced their<br />
emissions intensity to the level of the most<br />
carbon-efficient company within their industry.<br />
Figure 18 shows the SICS industries within<br />
the Infrastructure, Non-Renewable Resources<br />
Number of Companies<br />
Weighted Average Carbon<br />
Intensity (Scope 1 & 2 tCO2e/$m<br />
Revenue)<br />
Total Emissions of Disclosing<br />
Companies (tCO2e)<br />
Total Revenue ($m)<br />
and Resource Transformation SICS sectors<br />
in order of their potential to reduce carbon<br />
emissions relative to the total emissions<br />
intensity for the industry. The emissionsintensity<br />
reduction potential is shown by<br />
calculating the emissions that could be saved<br />
if every company reduced its emissions<br />
intensity to the level of the most carbonefficient<br />
company within its industry.<br />
Minimum Intensity for Industry<br />
(Scope 1 & 2 tCO2e/$m Revenue)<br />
Average Intensity for industry<br />
(Scope 1 & 2 tCO2e/$m Revenue)<br />
% Reduction if every Company<br />
lowers Emissions to level of most<br />
Carbon Efficient Intensity (Scope<br />
1 & 2 tCO2e/$m Revenue)<br />
GHG Emissions Reduction<br />
Potential if every Company<br />
lowers emissions to level of of<br />
most carbon efficient (tCO2e)<br />
Oil and Gas – Exploration and<br />
Production<br />
15 547 1,243,022,897 2,273 10 482 98 1,220,978,775<br />
Electric Utilities 13 1,030 871,567,417 846 109 723 89 779,768,017<br />
Chemicals 16 629 261,941,435 417 32 393 95 248,730,805<br />
Construction Materials 4 2,239 274,397,777 123 296 1,153 87 238,176,753<br />
Real Estate Owners, Developers<br />
and Investment Trusts<br />
9 621 107,138,767 172 3 149 99 106,586,984<br />
Metals and Mining 5 463 137,853,744 298 221 408 52 72,162,609<br />
Oil and Gas – Midstream 3 1,357 90,340,081 67 451 1,084 67 60,302,305<br />
Industrial Machinery and Goods 8 158 44,092,472 279 10 50 93 41,196,052<br />
Gas Utilities 3 382 28,863,371 76 94 194 75 21,780,144<br />
Electrical and Electronic<br />
Equipment<br />
Engineering and Construction<br />
Services<br />
12 35 21,574,662 615 15 31 59 12,655,628<br />
5 49 19,446,541 399 25 42 50 9,682,108<br />
Containers and Packaging 2 363 19,130,478 53 186 275 49 9,339,624<br />
Aerospace and Defense 8 22 9,736,823 440 13 18 42 4,054,821<br />
Oil and Gas – Services 3 80 6,796,369 84 35 59 57 3,865,787<br />
Waste Management 1 1,672 36,915,487 22 1,672 1,672 – –<br />
Integrated Utilities 1 5,231 31,000,022 6 5,231 5,231 – –<br />
Iron and Steel Producers 1 15 1,543,082 106 15 15 – –<br />
Home Builders 1 4 250,642 57 4 4 – –<br />
Average 12 828 178,089,559 352 468 666 71 199,097,510<br />
Total 220 15,725 3,383,701,626 6,685 8,890 12,649 1,068 2,986,462,657<br />
<strong>ET</strong> INDEX RESEARCH<br />
<strong>2016</strong> <strong>CARBON</strong> <strong>RANKINGS</strong> <strong>REPORT</strong>