- Page 2 and 3:
CANADA DOMINION BUREAU OF STATISTIC
- Page 4:
ISO* //V^ / / \ \ -w ^ If VFkaSgf
- Page 7 and 8:
STATISTICAL SUMMARY OF THE PROGRESS
- Page 9 and 10:
SYNOPTICAL TABLE OF CONTENTS. PAGE.
- Page 11 and 12:
vii Agricultural Prices. PAGE. 24.
- Page 13 and 14:
ix Vlll. Trade and Commerce—con.
- Page 15 and 16:
xi Telegraphs and Telephones—con.
- Page 17 and 18:
xiii Commercial Failures. PAGE . 60
- Page 19 and 20:
XV XIV. EXTRACTS FROM THE CANADA GA
- Page 21 and 22:
2 RECONSTRUCTION IN CANADA demand f
- Page 23 and 24:
4 RECONSTRUCTION IN CANADA for anim
- Page 25 and 26:
6 RECONSTRUCTION IN CANADA January
- Page 27 and 28:
8 RECONSTRUCTION IN CANADA with a c
- Page 29 and 30:
10 RECONSTRUCTION IN CANADA The fif
- Page 31 and 32:
12 RECONSTRUCTION IN CANADA exceedi
- Page 33 and 34:
14 RECONSTRUCTION IN CANADA This Ac
- Page 35 and 36:
16 RECONSTRUCTION IN CANADA Under t
- Page 37 and 38:
18 RECONSTRUCTION IN CANADA and rep
- Page 39 and 40:
20 RECONSTRUCTION IN CANADA Railway
- Page 41 and 42:
22 RECONSTRUCTION IN CANADA where r
- Page 43 and 44:
24 RECONSTRUCTION IN CANADA the wor
- Page 45 and 46:
26 RECONSTRUCTION IN CANADA EMPLOYM
- Page 47 and 48:
28 RECONSTRUCTION IN CANADA their w
- Page 49 and 50:
30 RECONSTRUCTION IN CANADA Subject
- Page 51 and 52:
32 RECONSTRUCTION IN CANADA The tot
- Page 53 and 54:
34 RECONSTRUCTION IN CANADA The sys
- Page 55 and 56:
36 RECONSTRUCTION IN CANADA rates.
- Page 57 and 58:
38 RECONSTRUCTION IN CANADA of them
- Page 59 and 60:
40 RECONSTRUCTION IN CANADA The ins
- Page 61 and 62:
42 RECONSTRUCTION IN CANADA man wer
- Page 63 and 64:
44 RECONSTRUCTION IN CANADA in the
- Page 65 and 66:
46 RECONSTRUCTION IN CANADA Act, in
- Page 67 and 68:
48 RECONSTRUCTION IN CANADA In Onta
- Page 69 and 70:
50 RECONSTRUCTION IN CANADA among t
- Page 71 and 72:
52 RECONSTRUCTION IN CANADA their t
- Page 73 and 74:
54 RECONSTRUCTION IN CANADA tempera
- Page 75 and 76:
56 RECONSTRUCTION IN CANADA The Cou
- Page 77 and 78:
58 RECONSTRUCTION IN CANADA NEED OF
- Page 79 and 80:
60 RECONSTRUCTION IN CANADA The Adm
- Page 82 and 83:
62 RECONSTRUCTION IN CANADA statist
- Page 84 and 85:
64 RECONSTRUCTION IN CANADA merely
- Page 86 and 87:
66 CHRONOLOGICAL HISTORY OF CANADA
- Page 88 and 89:
68 CHRONOLOGICAL HISTORY OF CANADA
- Page 90 and 91:
70 CHRONOLOGICAL HISTORY OF CANVDA
- Page 92 and 93:
72 CHRONOLOGICAL HISTORY OF CANADA
- Page 94 and 95:
74 CHRONOLOGICAL HISTORY OF CANADA
- Page 96 and 97:
76 CHRONOLOGICAL HISTORY OF CANADA
- Page 98 and 99:
78 PHYSICAL CHARACTERISTICS OF CANA
- Page 100 and 101:
80 PHYSICAL CHARACTERISTICS OF CANA
- Page 102 and 103:
82 PHYSICAL CHARACTERISTICS OF CANA
- Page 104 and 105:
84 PHYSICAL CHARACTERISTICS OF CANA
- Page 106 and 107:
86 PHYSICAL CHARACTERISTICS OF CANA
- Page 108 and 109:
88 PHYSICAL CHARACTERISTICS OF CANA
- Page 110 and 111:
90 PHYSICAL CHARACTERISTICS OF CANA
- Page 112 and 113:
92 PHYSICAL CHARACTERISTICS OF CANA
- Page 114 and 115:
94 AREA AND POPULATION Table 2 show
- Page 117 and 118:
96 AREA AND POPULATION 3.- Area and
- Page 119 and 120:
98 AREA AND POPULATION -Area and Po
- Page 121 and 122:
100 AREA AND POPULATION -Population
- Page 123 and 124:
102 AREA AND POPULATION Amongst oth
- Page 125 and 126:
104 AREA AND POPULATION 10.—Ratio
- Page 127 and 128:
106 AREA AND POPULATION Alberta was
- Page 129 and 130:
108 AREA AND POPULATION rates here
- Page 131 and 132:
110 AREA AND POPULATION 15.—Numbe
- Page 133 and 134:
112 AREA AND POPULATION 16.—Numbe
- Page 135 and 136:
114 AREA AND POPULATION 16.—Numbe
- Page 137 and 138:
116 AREA AND POPULATION 16.—Numbe
- Page 140 and 141:
118 AREA AND POPULATION 16.—Numbe
- Page 142 and 143:
120 AREA AND POPULATION 17, the inc
- Page 144 and 145:
122 AREA AND POPULATION 19.—Rejec
- Page 146 and 147:
124 AREA AND POPULATION 23.—Desti
- Page 148 and 149:
126 EDUCATION V.—EDUCATION. GENER
- Page 150 and 151:
128 EDUCATION the statistics of voc
- Page 152 and 153:
130 EDUCATION 1.—Statistical Summ
- Page 154 and 155:
132 EDUCATION 1.—Statistical Summ
- Page 156 and 157:
134 EDUCATION 3.—Number of School
- Page 158 and 159:
136 EDUCATION 2.—Number of School
- Page 160 and 161:
138 EDUCATION -Teachers in Training
- Page 162 and 163:
140 EDUCATION 3.—Teachers in Trai
- Page 164 and 165:
142 EDUCATION 7.—Number of Teache
- Page 166 and 167:
144 EDUCATION 10.—Receipts and Ex
- Page 168 and 169:
146 EDUCATION 10:—Receipts and Ex
- Page 170 and 171:
148 EDUCATION 10.—Receipts and Ex
- Page 172 and 173:
150 EDUCATION 12.—Universities of
- Page 174:
13.—Universities of Canada; Numbe
- Page 178:
15.—Universities of Canada: Numbe
- Page 182:
17.—Universities of Canada: Finan
- Page 186 and 187:
158 EDUCATION 18.—Colleges of Can
- Page 188 and 189:
160 EDUCATION 18.—Colleges of Can
- Page 190:
Name and Address. 30.—Colleges of
- Page 194 and 195:
164 CLIMATE AND METEOROLOGY VII.—
- Page 197:
MAP OF CANADA SHOWING NORMAL TEMPER
- Page 200 and 201:
166 CLIMATE AND METEOROLOGY followe
- Page 202 and 203:
168 CLIMATE AND METEOROLOGY THE WEA
- Page 204 and 205:
170 CLIMATE AND METEOROLOGY Winds a
- Page 206 and 207:
172 CLIMATE AND METEOROLOGY 1.—No
- Page 209:
OO OOOOOOO r OOOOOOOOOOOO OOOOOOOOO
- Page 213:
i mmmw lltlllllillz immnm mmrnxtz n
- Page 217:
* ^mmw * ^friiftp >^.Orf*.COW001tOC
- Page 220 and 221:
180 CLIMATE AND METEOROLOGY;'^ -Ave
- Page 222 and 223:
182 CLIMATE AND METEOROLOGY -Averag
- Page 224 and 225:
184 CLIMATE AND METEOROLOGY 2.—Av
- Page 226 and 227:
186 CLIMATE AND METEOROLOGY 2.—Av
- Page 228 and 229:
188 PRODUCTION VII.—PRODUCTION. I
- Page 230 and 231:
190 PRODUCTION tons fron 8,992,659
- Page 232 and 233:
192 PRODUCTION 1.—Area, Yield, Qu
- Page 234 and 235:
194 PRODUCTION -Area, Yield, Qualit
- Page 236 and 237:
196 PRODUCTION 1.—Area, Tield, Qu
- Page 238 and 239:
198 PRODUCTION -Area, Yield, Qualit
- Page 240 and 241:
200 PRODUCTION -Area, Yield, Qualit
- Page 242 and 243:
202 PRODUCTION 1.—Area, Yield, Qu
- Page 244 and 245:
204 PRODUCTION -Area, Yield, Qualit
- Page 246 and 247:
206 PRODUCTION -Area, Yield, Qualit
- Page 248 and 249:
208 PRODUCTION 1.- -Area, Yield, Qu
- Page 250 and 251:
210 PRODUCTION 1.—Area, Yield, Qu
- Page 252 and 253:
212 PRODUCTION -Annual Average Yiel
- Page 254 and 255:
214 PRODUCTION 4.—Total Areas and
- Page 256 and 257:
216 PRODUCTION Quality of Grain Cro
- Page 258 and 259:
218 PRODUCTION -Average Wages of Fa
- Page 260 and 261:
220 PRODUCTION 10.—Numbers of Far
- Page 262 and 263:
222 PRODUCTION 10.—Numbers of Far
- Page 264:
td I Isliili iiilili (O £•• W
- Page 267 and 268:
226 PRODUCTION 14.—Estimated Tota
- Page 269 and 270:
228 PRODUCTION Yukon. There were al
- Page 271 and 272:
230 PRODUCTION 16.—Production and
- Page 273 and 274:
232 PRODUCTION 18.—Miscellaneous
- Page 275 and 276:
234 PRODUCTION 21.—Production of
- Page 277 and 278:
236 PRODUCTION The varieties of whi
- Page 279 and 280:
238 PRODUCTION SUBSIDIZED AXD NON-S
- Page 281:
25.—Monthly Range of Average Pric
- Page 285:
25.—Monthly Range of Average Pric
- Page 288 and 289:
244 PRODUCTION 26.—Weekly fiange
- Page 290:
38.—Monthly Range of Average Pric
- Page 293:
28.—Monthly Bange of Average Pric
- Page 296 and 297:
250 PRODUCTION 29. -Monthly Range o
- Page 298 and 299:
252 PRODUCTION 32.—Average Prices
- Page 300 and 301:
254 PRODUCTION 34.—Average Prices
- Page 302 and 303:
256 PRODUCTION IIIIIIIIIIIHIII W5MN
- Page 304 and 305:
258 PRODUCTION tobacco in Ontario f
- Page 306 and 307:
260 PRODUCTION As will be noticed f
- Page 308 and 309:
262 PRODUCTION Adopting the simpler
- Page 310 and 311:
264 PRODUCTION 46.—Distribution o
- Page 312 and 313:
266 PRODUCTION 48—Distribution of
- Page 314 and 315:
268 PRODUCTION INTERNATIONAL AGRICU
- Page 316 and 317:
270 PRODUCTION 50.—Numbers of Far
- Page 318 and 319:
272 PRODUCTION 53.—World's Total
- Page 320 and 321:
274 PRODUCTION * .THt-HMCONiNM(OTfN
- Page 322 and 323:
276 PRODUCTION CO 00 ^ OS rH -^ •
- Page 324 and 325:
278 PRODUCTION :>< 0) 0) -^ . -5 ^2
- Page 326 and 327:
280 PRODUCTION Organization of the
- Page 328 and 329:
282 PRODUCTION cultural methods, as
- Page 330 and 331:
284 PRODUCTION The famous Oka chees
- Page 332 and 333:
286 PRODUCTION Practical experiment
- Page 334 and 335:
288 PRODUCTION FORESTRY. Up to and
- Page 336 and 337:
290 PRODUCTION 56.—Total Consumpt
- Page 338 and 339:
292 PRODUCTIOX 60.—Production of
- Page 340 and 341:
294 PRODUCTION to exceed $80 for an
- Page 342 and 343:
296 PRODUCTION from the Atlantic se
- Page 344 and 345:
298 PRODUCTION 66. -Quantities and
- Page 346 and 347:
300 PRODUCTION 68.—Quantity and V
- Page 348 and 349:
302 PRODUCTION 73.—Exports of the
- Page 350 and 351:
304 PRODUCTION 74. -Quantities and
- Page 352 and 353:
306 PRODUCTION 76.—Increase or De
- Page 354 and 355:
308 PRODUCTION 78.—Value of Miner
- Page 356 and 357:
310 PRODUCTION 83.—Quantity and V
- Page 358 and 359:
312 PRODUCTION 86.- Production of P
- Page 360 and 361:
314 PRODUCTION TURNBULL ELECTRO MET
- Page 362 and 363:
316 PRODUCTION decline in the deman
- Page 364 and 365:
318 PRODUCTION World's Production o
- Page 366 and 367:
320 PRODUCTION 95.—Imports into C
- Page 368 and 369:
322 W ¥MDUCTION number of employee
- Page 370 and 371:
324 PRODUCTION 98.—Summary Statis
- Page 372 and 373:
326 PRODUCTION 101.—Statistics of
- Page 374 and 375:
328 PRODUCTION 102.—Statistics of
- Page 376 and 377:
330 PRODUCTION 103.—Statistics of
- Page 378 and 379:
332 PRODUCTION 103.—Statistics of
- Page 380 and 381:
334 PRODUCTION 103.—Statistics of
- Page 382 and 383:
336 TRADE AND COMMERCE 106.—Wage
- Page 384 and 385:
AGGREGATE EXTERNAL TRADE 337 entere
- Page 386 and 387:
MOVEMENT OF COIN AND BULLION 339 2.
- Page 388 and 389:
VALUE PER CAPITA OF EXPORTS AND IMP
- Page 390 and 391:
IMPORTS OF CANADA 343 -Imports from
- Page 392 and 393:
EXPORTS OF CANADA 345 7.—Values o
- Page 394:
8.—Exports to the United Kingdom,
- Page 398:
9.—Imports from the United Kingdo
- Page 401 and 402:
EXPORTS OF CANADA 351 10.—Exports
- Page 403 and 404:
EXPORTS OF CANADA 353 10.- -Exports
- Page 405 and 406:
EXPORTS OF CANADA 355 U.—Exports
- Page 407 and 408:
EXPORTS OF CANADA 357 It.—Exports
- Page 409 and 410:
EXPORTS OF CANADA 359 U.~Eiports of
- Page 411 and 412:
EXPORTS OF CANADA 361 10.—Kiports
- Page 413 and 414:
EXPORTS OF CANADA 363 10.—Eiports
- Page 415 and 416:
EXPORTS OF CANADA 365 10.- -Exports
- Page 417 and 418:
EXPORTS OF CANADA 367 10.- -Exports
- Page 419 and 420:
EXPORTS OF CANADA 369 Id.—Exports
- Page 421 and 422:
EXPORTS OF CANADA 371 10.—Exports
- Page 423 and 424:
EXPORTS OF CANADA 373 10.—Exports
- Page 425 and 426:
EXPORTS OF CANADA 375 10.—Exports
- Page 427 and 428:
IMPORTS OF CANADA 377 ll^Imports of
- Page 429 and 430:
IMPORTS OF CANADA 379 11.— Import
- Page 431 and 432:
IMPORTS OF CANADA 381 11.—Imports
- Page 433 and 434:
IMPORTS OF CANADA 383 11.— Import
- Page 435 and 436:
IMPORTS OF CANADA 385 11.—Imports
- Page 437 and 438:
IMPORTS OF CANADA 387 11.—Imports
- Page 439 and 440:
IMPORTS OF CANADA 389 11.— Import
- Page 441 and 442:
IMPORTS OF CANADA 391 11.— Import
- Page 443 and 444:
IMPORTS OF CANADA 393 11.—Imports
- Page 445 and 446:
IMPORTS OF CANADA 395 11.—Imports
- Page 447 and 448:
IMPORTS OF CANADA 397 11.—Imports
- Page 449 and 450:
IMPORTS OF CANADA 399 11.—Imports
- Page 451 and 452:
IMPORTS OF CANADA 401 11 Imports of
- Page 453 and 454:
IMPORTS OF CANADA 403 11.—Imports
- Page 455 and 456:
IMPORTS OF CANADA 405 11.—Imports
- Page 457 and 458:
IMPORTS OF CANADA 407 11.—Imports
- Page 459 and 460:
TRADE WITH WEST INDIES 409 15.- -Va
- Page 461 and 462:
EXPORTS AND IMPORTS OF CANADA 411 1
- Page 463 and 464:
IMPORTS OF CANADA 413 20.—Imports
- Page 465 and 466:
AGGREGATE TRADE OF CANADA 415 31.
- Page 467 and 468:
EXPORTS OF CANADA 417 23.—Values
- Page 469 and 470:
IMPORTS AND EXPORTS OF CANADA 419 2
- Page 471 and 472:
FOOD IMPORTS OF THE UNITED KINGDOM
- Page 473 and 474:
FOOD IMPORTS OF THE UNITED KINGDOM
- Page 475 and 476:
EXPORTS OF THE UNITED STATES 425 27
- Page 477 and 478:
EXPORTS OF THE UNITED STATES 427 27
- Page 479 and 480:
EXPORTS OF THE UNITED STATES 429 27
- Page 481 and 482:
EXPORTS OF THE UNITED STATES 431 27
- Page 483 and 484:
EXPORTS OF THE UNITED STATES 433 27
- Page 485 and 486:
EXPORTS OF THE UNITED STATES 435 27
- Page 487 and 488:
EXPORTS OF THE UNITED STATES 437 27
- Page 489 and 490:
EXPORTS OF THE UNITED STATES 439 27
- Page 491 and 492:
EXPORTS OF THE UNITED STATES ' 441
- Page 493 and 494:
EXPORTS OF THE UNITED STATES 443 27
- Page 495 and 496:
EXPORTS OF THE UNITED STATES 445 27
- Page 497 and 498:
GRAIN STATISTICS 447 38.—Number a
- Page 499 and 500:
GRAIN STATISTICS 449 39.—Quantiti
- Page 501 and 502:
GRAIN STATISTICS 451 29.—Quantiti
- Page 503 and 504:
GRAIN STATISTICS 453 -Quantities of
- Page 505 and 506:
BOUNTIES 455 34.—Bounties paid in
- Page 507 and 508:
STEAM RAILWAYS 457 capitalization,
- Page 509 and 510:
STEAM RAILWAYS 459 shows for each y
- Page 511 and 512:
STEAM RAILWAYS 461 3.—Steam Railw
- Page 513 and 514:
STEAM RAILWAYS 463 4.—Mileage, Ca
- Page 515 and 516:
STEAM RAILWAYS 465 6.—Earnings an
- Page 517 and 518:
STEAM RAILWAYS 467 9.—Commodities
- Page 519 and 520:
STEAM RAILWAYS 469 11. —Number of
- Page 521 and 522:
STEAM RAILWAYS 471 16. -Cost of Con
- Page 523 and 524:
STEAM RAILWAYS 473 19.—Number of
- Page 525 and 526:
ELECTRIC RAILWAYS 475 23.—Mileage
- Page 527 and 528:
MOTOR VEHICLES 477 a great increase
- Page 529 and 530:
MOTOR VEHICLES 479 cycles must carr
- Page 531 and 532:
EXPRESS COMPANIES 481 during the wa
- Page 533 and 534:
EXPRESS COMPANIES 483 30.—Earning
- Page 535 and 536:
CANALS 485 there passed through the
- Page 537 and 538:
CANALS 487 35.—Principal Articles
- Page 539 and 540:
CANALS 489 37.—Traffic Through Ca
- Page 541 and 542:
CANALS 491 39.—Capital Expenditur
- Page 544 and 545: CANALS 493 41.—Traffic through th
- Page 546 and 547: SHIPPING 495 42.—Sea-going Vessel
- Page 548 and 549: SHIPPING 497 44.—Sea-going Vessel
- Page 550 and 551: SHIPPING 499 47.—British and Fore
- Page 552 and 553: SHIPPING 501 49.—Vessels built an
- Page 554 and 555: SHIPPING 503 Wrecks and Casualties.
- Page 556 and 557: SHIPPING 505 57.—Total Revenue an
- Page 558 and 559: TELEGRAPHS 507 58.—Telegraph Stat
- Page 560 and 561: WIRELESS TELEGRAPHY 509 59. -Coast
- Page 562 and 563: TELEPHONES 511 1918, and the net re
- Page 564 and 565: TELEPHONES 513 $6.—Capital Liabil
- Page 566 and 567: POSTAL STATISTICS 515 68.- Statisti
- Page 568 and 569: POSTAL STATISTICS 517 70.—Mail Su
- Page 570 and 571: POSTAL STATISTICS 519 72.—Money O
- Page 572 and 573: POSTAL STATISTICS 521 74.—Issue o
- Page 574 and 575: DISTRIBUTION OF LABOUR BY INDUSTRIE
- Page 576 and 577: DOMINION DEPARTMENT OF LABOUR 525 4
- Page 578 and 579: oards were established. but three c
- Page 580 and 581: ORGANIZED LABOUR IN CANADA 529 besi
- Page 582 and 583: ORGANIZED LABOUR IN CANADA 531 6.
- Page 584 and 585: TRADE DISPUTES 533 8.—Time Losses
- Page 586 and 587: EMPLOYMENT 535 employment offices r
- Page 588 and 589: fe S3 III b CD o £>S 3 5.BIB - !§
- Page 590: 15.—Wages per Hour and Hours work
- Page 594: 17.—Sample Wages Paid and Hours W
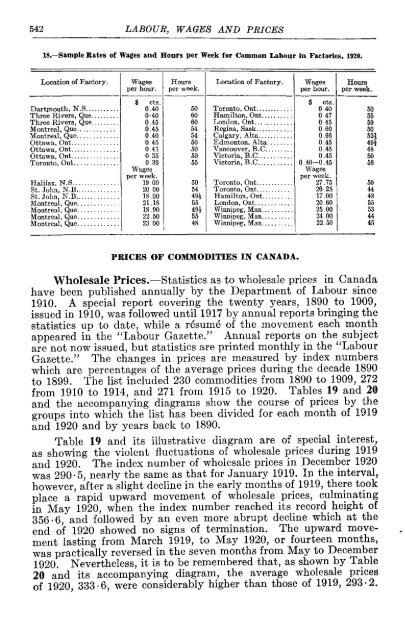
- Page 599 and 600: PRICES OF COMMODITIES IN CANADA 545
- Page 602 and 603: PRICES OF COMMODITIES IN CANADA 547
- Page 604: 21.—Weekly Cost of a Family Budge
- Page 608 and 609: PUBLIC ACCOUNTS 551 XL—FINANCE. U
- Page 610 and 611: PUBLIC ACCOUNTS 553 2.—Detailed R
- Page 612 and 613: PUBLIC ACCOUNTS 555 4.—War Tax Re
- Page 614 and 615: PUBLIC ACCOUNTS 557 8.—Assets of
- Page 616 and 617: PUBLIC ACCOUNTS 559 Provincial Subs
- Page 618 and 619: INLAND REVENUE 561 But under the in
- Page 620 and 621: INLAND REVENUE 563 17.—Number of
- Page 622 and 623: PROVINCIAL PUBLIC ACCOUNTS 565 18.
- Page 624 and 625: PROVINCIAL PUBLIC ACCOUNTS 567 20.
- Page 626 and 627: PROVINCIAL PUBLIC ACCOUNTS 569 Prov
- Page 628 and 629: PROVINCIAL PUBLIC ACCOUNTS 571 Prov
- Page 631: 23. Population, assessed value of T
- Page 634 and 635: RECEIPTS 575 21. -Receipts, ordinar
- Page 636 and 637: EXPENDITURE OF CITIES 577 25.—Exp
- Page 638 and 639: AVAILABLE ASSETS OF CITIES 579 26.
- Page 640 and 641: BUILDING PERMITS 581 Building Permi
- Page 642 and 643: STATEMENT OF ASSETS 583 29.—State
- Page 644 and 645: MUNICIPAL ELECTRICAL INSTALLATIONS
- Page 646 and 647:
MUNICIPAL ELECTRICAL INSTALLATIONS
- Page 648 and 649:
MUNICIPAL ELECTRICAL INSTALLATIONS
- Page 650 and 651:
MUNICIPAL ELECTRICAL INSTALLATIONS
- Page 652 and 653:
CURRENCY AND BANKING 593 the event
- Page 654 and 655:
CURRENCY AND BANKING &?£ .2 ^laoWH
- Page 656 and 657:
CURRENCY AND BANKINO 597 extension
- Page 659 and 660:
CURRENCY AND BANKING 599 40.—Numb
- Page 662 and 663:
CURRENCY AND BANKING 601 43. -Numbe
- Page 665:
44.—Liabilities of Chartered Bank
- Page 668 and 669:
CURRENCY AND BANKING 605 47.- -Disc
- Page 670 and 671:
CURRENCY AND BANKING 607 50.—Amou
- Page 672 and 673:
CURRENCY AND BANKING 609 53.—Rati
- Page 674 and 675:
LOAN AND TRUST COMPANIES 611 57.—
- Page 676 and 677:
COMMERCIAL FAILURES 613 60.—Comme
- Page 678 and 679:
COMMERCIAL FAILURES 615 62.—Comme
- Page 680 and 681:
COMMERCIAL FAILURES 617 O-o Si jgsi
- Page 682 and 683:
GOVERNMENT ANNUITIES 619 GOVERNMENT
- Page 684 and 685:
INSURANCE 621 in 1919 amounted to $
- Page 686 and 687:
INSURANCE 623 68.—Fire Insurance
- Page 688 and 689:
INSURANCE 625 68.—Fire Insurance
- Page 690 and 691:
INSURANCE -627 71.—Fire Insurance
- Page 692 and 693:
INSURANCE 629 74.—Liabilities of
- Page 694 and 695:
INSURANCE 631 75.—Cash Income and
- Page 696 and 697:
INSURANCE 633 77.—Life Insurance
- Page 698 and 699:
INSURANCE 635 80.—Liabilities of
- Page 700 and 701:
INSURANCE 637 81.—Cash Income and
- Page 702 and 703:
A B C Year. 1914. INSURANCE 639 85.
- Page 704 and 705:
INSURANCE 641 88.—Income and Expe
- Page 706 and 707:
INSURANCE 643 91.—Dominion and Pr
- Page 708 and 709:
PARLIAMENTARY REPRESENTATION 645 el
- Page 710 and 711:
PARLIAMENTARY REPRESENTATION 647 -R
- Page 712 and 713:
DOMINION PARLIAMENTS 649 3.—Domin
- Page 714 and 715:
DOMINION MINISTRIES 651 Office. 4.
- Page 716 and 717:
DOMINION MINISTRIES 653 4.—Domini
- Page 718 and 719:
PUBLIC LANDS 655 PUBLIC LANDS. Domi
- Page 720 and 721:
PUBLIC LANDS 657 Homestead Entries.
- Page 722 and 723:
PUBLIC LANDS 659 than pine, and in
- Page 724 and 725:
HOMESTEAD ENTRIES 661 $250 to $10,0
- Page 726 and 727:
DEPARTMENT OF THE SECRETARY OF STAT
- Page 728 and 729:
INDIAN AFFAIRS 665 INDIAN AFFAIRS.
- Page 730 and 731:
INDIAN AFFAIRS 667 14.—Attendance
- Page 732 and 733:
PUBLIC WORKS 6G9 PUBLIC WORKS. Sinc
- Page 734 and 735:
PUBLIC WORKS 671 21.—Expenditure
- Page 736 and 737:
PUBLIC DEFENCE 673 war on August 4,
- Page 738 and 739:
PUBLIC DEFENCE 675 23.—Expenditur
- Page 740 and 741:
PUBLIC DEFENCE 677 24.—Expenditur
- Page 742 and 743:
i PUBLIC DEFENCE 679 the year comme
- Page 744 and 745:
SCALE OF ANNUAL PENSIONS 681 the Ca
- Page 746 and 747:
PUBLIC DEFENCE 683 College, as stat
- Page 748 and 749:
DEPARTMENT OF NAVAL SERVICE 685 30,
- Page 750 and 751:
CRIMINAL STATISTICS 687 31.—Convi
- Page 752 and 753:
CRIMINAL STATISTICS 689 convictions
- Page 754 and 755:
CRIMINAL STATISTICS 691 34. -Classi
- Page 757 and 758:
CRIMINAL STATISTICS 693 Decrease of
- Page 759 and 760:
PENITENTIARIES 695 39.—Number of
- Page 761 and 762:
STATISTICS OF DIVORCE 697 12.—Sta
- Page 763 and 764:
LIST OF DOMINION ACTS OF PARLIAMENT
- Page 765 and 766:
DOMINION GOVERNMENT PUBLICATIONS 70
- Page 767 and 768:
DOMINION GOVERNMENT PUBLICATIONS 70
- Page 769 and 770:
DOMINION GOVERNMENT PUBLICATIONS 70
- Page 771 and 772:
PROVINCIAL GOVERNMENT PUBLICATIONS
- Page 773 and 774:
PROVINCIAL GOVERNMENT PUBLICATIONS
- Page 775 and 776:
PROVINCIAL GOVERNMENT PUBLICATIONS
- Page 777 and 778:
PROVINCIAL GOVERNMENT PUBLICATIONS
- Page 779 and 780:
DOMINION LEGISLATION, 1920 715 Trad
- Page 781 and 782:
DOMINION LEGISLATION, 1920 717 Indi
- Page 783 and 784:
DOMINION LEGISLATION, 1920 719 Sett
- Page 785 and 786:
PROVINCIAL LEGISLATION, 1920 721 Ho
- Page 787 and 788:
PROVINCIAL LEGISLATION, 1920 723 am
- Page 789 and 790:
PROVINCIAL LEGISLATION, 1920 725 an
- Page 791 and 792:
PROVINCIAL LEGISLATION, 1920 727 Ro
- Page 793 and 794:
PROVINCIAL LEGISLATION, 1920 729 ca
- Page 795 and 796:
PROVINCIAL LEGISLATION, 1920 731 ar
- Page 797 and 798:
PROVINCIAL LEGISLATION, 1920 733 th
- Page 799 and 800:
PROVINCIAL LEGISLATION, 1920 735 a
- Page 801 and 802:
PROVINCIAL LEGISLATION, 1920 737 by
- Page 803 and 804:
"TBI THE FIRST ASSEMBLY OF THE LEAG
- Page 805 and 806:
THE FIRST ASSEMBLY OF THE LEAGUE OF
- Page 807 and 808:
CONVENTION OF AMERICAN FEDERATION O
- Page 809 and 810:
PROHIBITION PLEBISCITES 745 news of
- Page 811 and 812:
OBITUARY ?47 for employers to conti
- Page 813 and 814:
NEW SENATORS 749 New Senators.—Th
- Page 815 and 816:
JUDICIAL APPOINTMENTS 751 which the
- Page 817 and 818:
OFFICIAL APPOINTMENTS 753 Canada in
- Page 819 and 820:
INDEX 755 PAGE. Beer, duty per head
- Page 821 and 822:
INDEX 757 PAGE. Dominion Parliament
- Page 823 and 824:
INDEX 759 PAGE. Hydro-Electricity,
- Page 825 and 826:
INDEX 761 PAGE. Militia, expenditur
- Page 827 and 828:
INDEX 763 PAGE. Provincial agricult
- Page 829 and 830:
INDEX 765 PAGE. Shipping, vessels,
- Page 831 and 832:
INDEX 767 PAGE. T rade and Commerce