Global Competetiveness Report

Create successful ePaper yourself
Turn your PDF publications into a flip-book with our unique Google optimized e-Paper software.
Natural Capital<br />
Executive summary<br />
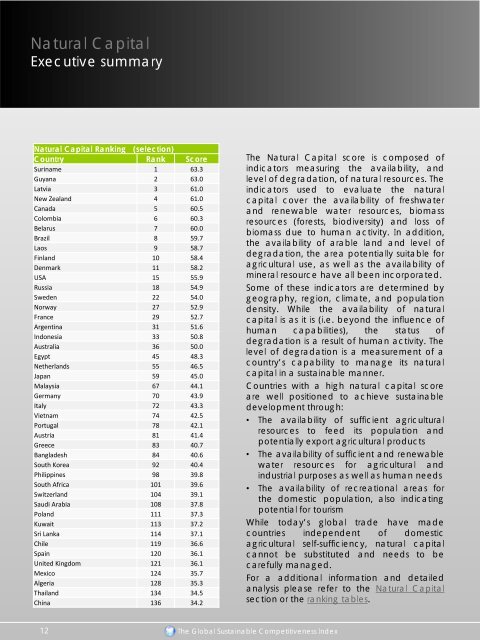
Natural Capital Ranking (selection)<br />
Country Rank Score<br />
Suriname 1 63.3<br />
Guyana 2 63.0<br />
Latvia 3 61.0<br />
New Zealand 4 61.0<br />
Canada 5 60.5<br />
Colombia 6 60.3<br />
Belarus 7 60.0<br />
Brazil 8 59.7<br />
Laos 9 58.7<br />
Finland 10 58.4<br />
Denmark 11 58.2<br />
USA 15 55.9<br />
Russia 18 54.9<br />
Sweden 22 54.0<br />
Norway 27 52.9<br />
France 29 52.7<br />
Argentina 31 51.6<br />
Indonesia 33 50.8<br />
Australia 36 50.0<br />
Egypt 45 48.3<br />
Netherlands 55 46.5<br />
Japan 59 45.0<br />
Malaysia 67 44.1<br />
Germany 70 43.9<br />
Italy 72 43.3<br />
Vietnam 74 42.5<br />
Portugal 78 42.1<br />
Austria 81 41.4<br />
Greece 83 40.7<br />
Bangladesh 84 40.6<br />
South Korea 92 40.4<br />
Philippines 98 39.8<br />
South Africa 101 39.6<br />
Switzerland 104 39.1<br />
Saudi Arabia 108 37.8<br />
Poland 111 37.3<br />
Kuwait 113 37.2<br />
Sri Lanka 114 37.1<br />
Chile 119 36.6<br />
Spain 120 36.1<br />
United Kingdom 121 36.1<br />
Mexico 124 35.7<br />
Algeria 128 35.3<br />
Thailand 134 34.5<br />
China 136 34.2<br />
The Natural Capital score is composed of<br />
indicators measuring the availability, and<br />
level of degradation, of natural resources. The<br />
indicators used to evaluate the natural<br />
capital cover the availability of freshwater<br />
and renewable water resources, biomass<br />
resources (forests, biodiversity) and loss of<br />
biomass due to human activity. In addition,<br />
the availability of arable land and level of<br />
degradation, the area potentially suitable for<br />
agricultural use, as well as the availability of<br />
mineral resource have all been incorporated.<br />
Some of these indicators are determined by<br />
geography, region, climate, and population<br />
density. While the availability of natural<br />
capital is as it is (i.e. beyond the influence of<br />
human capabilities), the status of<br />
degradation is a result of human activity. The<br />
level of degradation is a measurement of a<br />
country’s capability to manage its natural<br />
capital in a sustainable manner.<br />
Countries with a high natural capital score<br />
are well positioned to achieve sustainable<br />
development through:<br />
• The availability of sufficient agricultural<br />
resources to feed its population and<br />
potentially export agricultural products<br />
• The availability of sufficient and renewable<br />
water resources for agricultural and<br />
industrial purposes as well as human needs<br />
• The availability of recreational areas for<br />
the domestic population, also indicating<br />
potential for tourism<br />
While today’s global trade have made<br />
countries independent of domestic<br />
agricultural self-sufficiency, natural capital<br />
cannot be substituted and needs to be<br />
carefully managed.<br />
For a additional information and detailed<br />
analysis please refer to the Natural Capital<br />
section or the ranking tables.<br />
12<br />
The <strong>Global</strong> Sustainable Competitiveness Index