Global Competetiveness Report

You also want an ePaper? Increase the reach of your titles
YUMPU automatically turns print PDFs into web optimized ePapers that Google loves.
Country Rankings<br />
Natural Capital<br />
The natural capital of a country is mainly<br />
determined by factors beyond the influence<br />
of humanity: geography, climate, water<br />
resources, mineral resources. However, the<br />
efficient and sustainable use - and therefore<br />
the level of depletion – is a result of human<br />
activity and therefore can be directed<br />
through positive and negative incentives.<br />
The countries on the bottom of the natural<br />
capital ranking - which includes the two<br />
largest countries by population, China (133)<br />
and India (156) - are highly likely to face<br />
barriers to sustainable and sustained<br />
development. Depending on the country, its<br />
location, geography, climate and<br />
population, these obstacles might include:<br />
• limitations to agricultural output due to<br />
lack of water, desertification, and pollution<br />
• Increasing desertification of arable land<br />
• Loss of biodiversity<br />
• Water constraints, affecting agriculture,<br />
human needs, and the economy<br />
• Potential conflict over resources. The ongoing<br />
violent conflict in Darfur, for<br />
example, is in its essence a conflict over<br />
limited natural resources (water,<br />
agricultural land, grazing land) in an arid<br />
region amidst the background of<br />
increasing population pressure<br />
Countries facing any of these constraints<br />
need to develop a long-term strategy to<br />
counter its specific treats. Potential counterstrategies<br />
include negative incentives<br />
(regulation, protection, contingents) as well<br />
as positive incentives (investments, market<br />
incentives, subsidies, educational support,<br />
targeted R&D).<br />
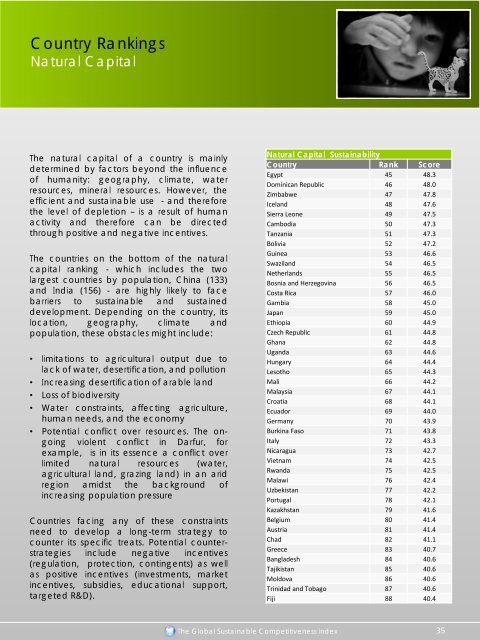
Natural Capital Sustainability<br />
Country Rank Score<br />
Egypt 45 48.3<br />
Dominican Republic 46 48.0<br />
Zimbabwe 47 47.8<br />
Iceland 48 47.6<br />
Sierra Leone 49 47.5<br />
Cambodia 50 47.3<br />
Tanzania 51 47.3<br />
Bolivia 52 47.2<br />
Guinea 53 46.6<br />
Swaziland 54 46.5<br />
Netherlands 55 46.5<br />
Bosnia and Herzegovina 56 46.5<br />
Costa Rica 57 46.0<br />
Gambia 58 45.0<br />
Japan 59 45.0<br />
Ethiopia 60 44.9<br />
Czech Republic 61 44.8<br />
Ghana 62 44.8<br />
Uganda 63 44.6<br />
Hungary 64 44.4<br />
Lesotho 65 44.3<br />
Mali 66 44.2<br />
Malaysia 67 44.1<br />
Croatia 68 44.1<br />
Ecuador 69 44.0<br />
Germany 70 43.9<br />
Burkina Faso 71 43.8<br />
Italy 72 43.3<br />
Nicaragua 73 42.7<br />
Vietnam 74 42.5<br />
Rwanda 75 42.5<br />
Malawi 76 42.4<br />
Uzbekistan 77 42.2<br />
Portugal 78 42.1<br />
Kazakhstan 79 41.6<br />
Belgium 80 41.4<br />
Austria 81 41.4<br />
Chad 82 41.1<br />
Greece 83 40.7<br />
Bangladesh 84 40.6<br />
Tajikistan 85 40.6<br />
Moldova 86 40.6<br />
Trinidad and Tobago 87 40.6<br />
Fiji 88 40.4<br />
The <strong>Global</strong> Sustainable Competitiveness Index<br />
35