Global Competetiveness Report

Create successful ePaper yourself
Turn your PDF publications into a flip-book with our unique Google optimized e-Paper software.
Country rankings<br />
Sustainable Competitiveness<br />
Sustainable Competitiveness<br />
Country Rank Score<br />
Denmark 1 58.8<br />
Sweden 2 58.5<br />
Norway 3 57.6<br />
Austria 4 57.6<br />
Finland 5 57.6<br />
Switzerland 6 56.5<br />
Germany 7 56.2<br />
Netherlands 8 56.2<br />
Japan 9 56.0<br />
Ireland 10 55.7<br />
Iceland 11 55.7<br />
Canada 12 55.6<br />
Luxembourg 13 55.0<br />
New Zealand 14 54.4<br />
France 15 54.4<br />
Belgium 16 52.5<br />
Belarus 17 52.3<br />
Czech Republic 18 52.3<br />
Slovenia 19 50.6<br />
Portugal 20 50.3<br />
Singapore 21 50.0<br />
Spain 22 49.9<br />
Australia 23 49.9<br />
Estonia 24 49.8<br />
Brazil 25 49.5<br />
United Kingdom 26 49.5<br />
Croatia 27 49.5<br />
Italy 28 49.2<br />
Lithuania 29 48.7<br />
USA 30 48.4<br />
Latvia 31 48.4<br />
Slovakia 32 47.7<br />
South Korea 33 47.7<br />
Argentina 34 47.5<br />
Romania 35 47.4<br />
China 36 47.3<br />
Malta 37 47.2<br />
Costa Rica 38 47.1<br />
Colombia 39 47.0<br />
Greece 40 46.8<br />
Uruguay 41 46.7<br />
Poland 42 46.6<br />
Guyana 43 46.2<br />
Tajikistan 44 46.1<br />
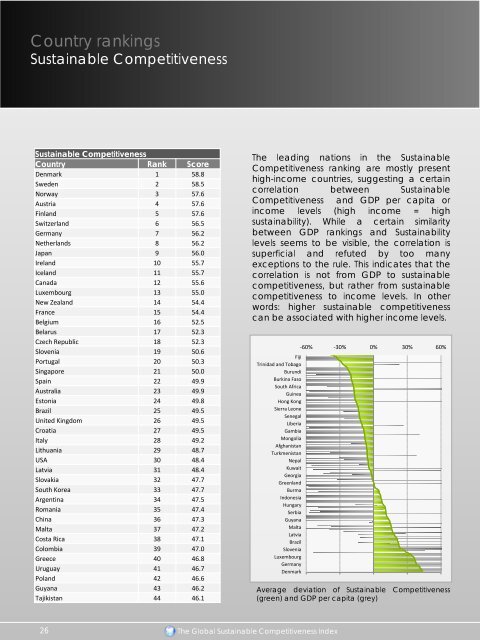
The leading nations in the Sustainable<br />
Competitiveness ranking are mostly present<br />
high-income countries, suggesting a certain<br />
correlation between Sustainable<br />
Competitiveness and GDP per capita or<br />
income levels (high income = high<br />
sustainability). While a certain similarity<br />
between GDP rankings and Sustainability<br />
levels seems to be visible, the correlation is<br />
superficial and refuted by too many<br />
exceptions to the rule. This indicates that the<br />
correlation is not from GDP to sustainable<br />
competitiveness, but rather from sustainable<br />
competitiveness to income levels. In other<br />
words: higher sustainable competitiveness<br />
can be associated with higher income levels.<br />
-60% -30% 0% 30% 60%<br />
Fiji<br />
Trinidad and Tobago<br />
Burundi<br />
Burkina Faso<br />
South Africa<br />
Guinea<br />
Hong Kong<br />
Sierra Leone<br />
Senegal<br />
Liberia<br />
Gambia<br />
Mongolia<br />
Afghanistan<br />
Turkmenistan<br />
Nepal<br />
Kuwait<br />
Georgia<br />
Greenland<br />
Burma<br />
Indonesia<br />
Hungary<br />
Serbia<br />
Guyana<br />
Malta<br />
Latvia<br />
Brazil<br />
Slovenia<br />
Luxembourg<br />
Germany<br />
Denmark<br />
Average deviation of Sustainable Competitiveness<br />
(green) and GDP per capita (grey)<br />
26<br />
The <strong>Global</strong> Sustainable Competitiveness Index