Orange County Benchmarking and Target Industry Analysis: Spotlight
Orange County Benchmarking and Target Industry Analysis: Spotlight
Orange County Benchmarking and Target Industry Analysis: Spotlight

Create successful ePaper yourself
Turn your PDF publications into a flip-book with our unique Google optimized e-Paper software.
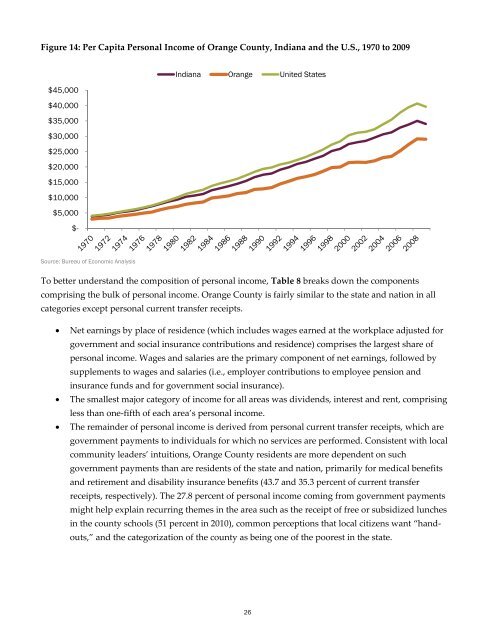
Figure 14: Per Capita Personal Income of <strong>Orange</strong> <strong>County</strong>, Indiana <strong>and</strong> the U.S., 1970 to 2009<br />
$45,000<br />
$40,000<br />
$35,000<br />
$30,000<br />
$25,000<br />
$20,000<br />
$15,000<br />
$10,000<br />
$5,000<br />
$-<br />
Source: Bureau of Economic <strong>Analysis</strong><br />
Indiana <strong>Orange</strong> United States<br />
To better underst<strong>and</strong> the composition of personal income, Table 8 breaks down the components<br />
comprising the bulk of personal income. <strong>Orange</strong> <strong>County</strong> is fairly similar to the state <strong>and</strong> nation in all<br />
categories except personal current transfer receipts.<br />
� Net earnings by place of residence (which includes wages earned at the workplace adjusted for<br />
government <strong>and</strong> social insurance contributions <strong>and</strong> residence) comprises the largest share of<br />
personal income. Wages <strong>and</strong> salaries are the primary component of net earnings, followed by<br />
supplements to wages <strong>and</strong> salaries (i.e., employer contributions to employee pension <strong>and</strong><br />
insurance funds <strong>and</strong> for government social insurance).<br />
� The smallest major category of income for all areas was dividends, interest <strong>and</strong> rent, comprising<br />
less than one‐fifth of each area’s personal income.<br />
� The remainder of personal income is derived from personal current transfer receipts, which are<br />
government payments to individuals for which no services are performed. Consistent with local<br />
community leaders’ intuitions, <strong>Orange</strong> <strong>County</strong> residents are more dependent on such<br />
government payments than are residents of the state <strong>and</strong> nation, primarily for medical benefits<br />
<strong>and</strong> retirement <strong>and</strong> disability insurance benefits (43.7 <strong>and</strong> 35.3 percent of current transfer<br />
receipts, respectively). The 27.8 percent of personal income coming from government payments<br />
might help explain recurring themes in the area such as the receipt of free or subsidized lunches<br />
in the county schools (51 percent in 2010), common perceptions that local citizens want “h<strong>and</strong>‐<br />
outs,” <strong>and</strong> the categorization of the county as being one of the poorest in the state.<br />
26