Orange County Benchmarking and Target Industry Analysis: Spotlight
Orange County Benchmarking and Target Industry Analysis: Spotlight
Orange County Benchmarking and Target Industry Analysis: Spotlight

Create successful ePaper yourself
Turn your PDF publications into a flip-book with our unique Google optimized e-Paper software.
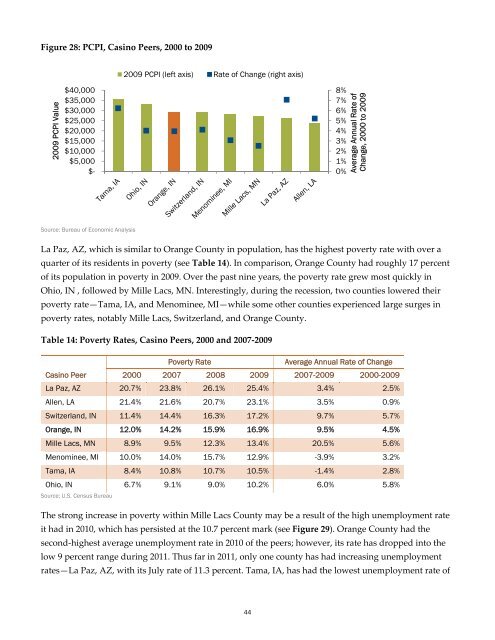
Figure 28: PCPI, Casino Peers, 2000 to 2009<br />
2009 PCPI Value<br />
$40,000<br />
$35,000<br />
$30,000<br />
$25,000<br />
$20,000<br />
$15,000<br />
$10,000<br />
$5,000<br />
$-<br />
Source: Bureau of Economic <strong>Analysis</strong><br />
La Paz, AZ, which is similar to <strong>Orange</strong> <strong>County</strong> in population, has the highest poverty rate with over a<br />
quarter of its residents in poverty (see Table 14). In comparison, <strong>Orange</strong> <strong>County</strong> had roughly 17 percent<br />
of its population in poverty in 2009. Over the past nine years, the poverty rate grew most quickly in<br />
Ohio, IN , followed by Mille Lacs, MN. Interestingly, during the recession, two counties lowered their<br />
poverty rate—Tama, IA, <strong>and</strong> Menominee, MI—while some other counties experienced large surges in<br />
poverty rates, notably Mille Lacs, Switzerl<strong>and</strong>, <strong>and</strong> <strong>Orange</strong> <strong>County</strong>.<br />
Table 14: Poverty Rates, Casino Peers, 2000 <strong>and</strong> 2007‐2009<br />
Casino Peer<br />
Poverty Rate Average Annual Rate of Change<br />
2000 2007 2008 2009 2007-2009 2000-2009<br />
La Paz, AZ 20.7% 23.8% 26.1% 25.4% 3.4% 2.5%<br />
Allen, LA 21.4% 21.6% 20.7% 23.1% 3.5% 0.9%<br />
Switzerl<strong>and</strong>, IN 11.4% 14.4% 16.3% 17.2% 9.7% 5.7%<br />
<strong>Orange</strong>, IN 12.0% 14.2% 15.9% 16.9% 9.5% 4.5%<br />
Mille Lacs, MN 8.9% 9.5% 12.3% 13.4% 20.5% 5.6%<br />
Menominee, MI 10.0% 14.0% 15.7% 12.9% -3.9% 3.2%<br />
Tama, IA 8.4% 10.8% 10.7% 10.5% -1.4% 2.8%<br />
Ohio, IN 6.7% 9.1% 9.0% 10.2% 6.0% 5.8%<br />
Source: U.S. Census Bureau<br />
2009 PCPI (left axis) Rate of Change (right axis)<br />
The strong increase in poverty within Mille Lacs <strong>County</strong> may be a result of the high unemployment rate<br />
it had in 2010, which has persisted at the 10.7 percent mark (see Figure 29). <strong>Orange</strong> <strong>County</strong> had the<br />
second‐highest average unemployment rate in 2010 of the peers; however, its rate has dropped into the<br />
low 9 percent range during 2011. Thus far in 2011, only one county has had increasing unemployment<br />
rates—La Paz, AZ, with its July rate of 11.3 percent. Tama, IA, has had the lowest unemployment rate of<br />
44<br />
8%<br />
7%<br />
6%<br />
5%<br />
4%<br />
3%<br />
2%<br />
1%<br />
0%<br />
Average Annual Rate of<br />
Change, 2000 to 2009