

The First 100 Days
The_First_100_Days_US-Canada_version
The_First_100_Days_US-Canada_version

You also want an ePaper? Increase the reach of your titles
YUMPU automatically turns print PDFs into web optimized ePapers that Google loves.
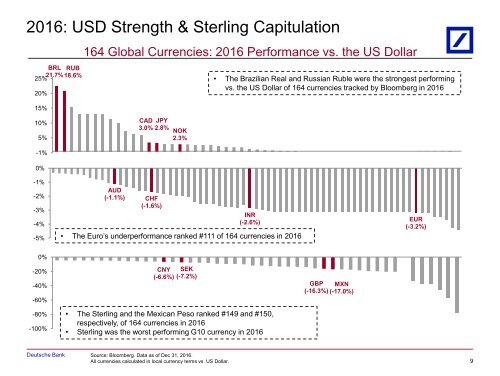
2016: USD Strength & Sterling Capitulation<br />
BRL RUB<br />
21.7%<br />
25%<br />
18.6%<br />
20%<br />
15%<br />
164 Global Currencies: 2016 Performance vs. the US Dollar<br />
• <strong>The</strong> Brazilian Real and Russian Ruble were the strongest performing<br />
vs. the US Dollar of 164 currencies tracked by Bloomberg in 2016<br />
10%<br />
5%<br />
CAD JPY<br />
3.0% 2.8% NOK<br />
2.3%<br />
-1%<br />
0%<br />
-1%<br />
-2%<br />
-3%<br />
-4%<br />
-5%<br />
AUD<br />
(-1.1%) CHF<br />
(-1.6%)<br />
INR<br />
(-2.6%)<br />
• <strong>The</strong> Euro’s underperformance ranked #111 of 164 currencies in 2016<br />
EUR<br />
(-3.2%)<br />
0%<br />
-20%<br />
-40%<br />
-60%<br />
-80%<br />
-<strong>100</strong>%<br />
CNY SEK<br />
(-6.6%) (-7.2%)<br />
• <strong>The</strong> Sterling and the Mexican Peso ranked #149 and #150,<br />
respectively, of 164 currencies in 2016<br />
• Sterling was the worst performing G10 currency in 2016<br />
GBP MXN<br />
(-16.3%) (-17.0%)<br />
Deutsche Bank<br />
Source: Bloomberg. Data as of Dec 31, 2016.<br />
All currencies calculated in local currency terms vs. US Dollar.<br />
9