

The First 100 Days
The_First_100_Days_US-Canada_version
The_First_100_Days_US-Canada_version

Create successful ePaper yourself
Turn your PDF publications into a flip-book with our unique Google optimized e-Paper software.
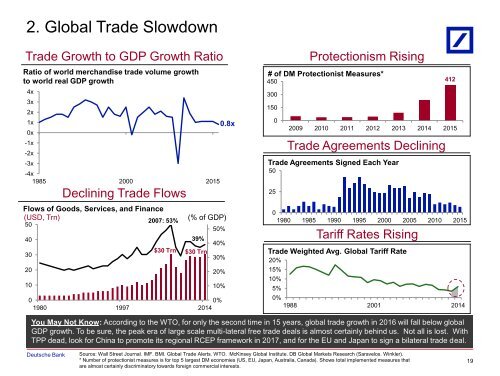
2. Global Trade Slowdown<br />
Trade Growth to GDP Growth Ratio<br />
Ratio of world merchandise trade volume growth<br />
to world real GDP growth<br />
4x<br />
3x<br />
2x<br />
1x<br />
0x<br />
-1x<br />
-2x<br />
-3x<br />
-4x<br />
1985 2000 2015<br />
Declining Trade Flows<br />
Flows of Goods, Services, and Finance<br />
(USD, Trn)<br />
50<br />
40<br />
30<br />
20<br />
10<br />
2007: 53%<br />
(% of GDP)<br />
39%<br />
$30 Trn $30 Trn<br />
50%<br />
40%<br />
30%<br />
20%<br />
10%<br />
0<br />
0%<br />
1980 1997 2014<br />
0.8x<br />
Protectionism Rising<br />
# of DM Protectionist Measures*<br />
450<br />
300<br />
150<br />
0<br />
Trade Agreements Declining<br />
Trade Agreements Signed Each Year<br />
50<br />
25<br />
0<br />
1980 1985 1990 1995 2000 2005 2010 2015<br />
Tariff Rates Rising<br />
Trade Weighted Avg. Global Tariff Rate<br />
20%<br />
15%<br />
10%<br />
5%<br />
412<br />
2009 2010 2011 2012 2013 2014 2015<br />
0%<br />
1988 2001 2014<br />
You May Not Know: According to the WTO, for only the second time in 15 years, global trade growth in 2016 will fall below global<br />
GDP growth. To be sure, the peak era of large scale multi-lateral free trade deals is almost certainly behind us. Not all is lost. With<br />
TPP dead, look for China to promote its regional RCEP framework in 2017, and for the EU and Japan to sign a bilateral trade deal.<br />
Deutsche Bank<br />
Source: Wall Street Journal. IMF. BMI. Global Trade Alerts. WTO. McKinsey Global Institute. DB Global Markets Research (Saravelos. Winkler).<br />
* Number of protectionist measures is for top 5 largest DM economies (US, EU, Japan, Australia, Canada). Shows total implemented measures that<br />
are almost certainly discriminatory towards foreign commercial interests.<br />
19