Thousands
2k5pO0I
2k5pO0I

You also want an ePaper? Increase the reach of your titles
YUMPU automatically turns print PDFs into web optimized ePapers that Google loves.
<strong>Thousands</strong><br />
10:00<br />
10:15<br />
10:30<br />
10:45<br />
11:00<br />
11:15<br />
11:30<br />
11:45<br />
12:00<br />
12:15<br />
12:30<br />
12:45<br />
13:00<br />
13:15<br />
13:30<br />
13:45<br />
14:00<br />
14:15<br />
14:30<br />
14:45<br />
26-Jan<br />
29-Jan<br />
30-Jan<br />
31-Jan<br />
1-Feb<br />
2-Feb<br />
5-Feb<br />
6-Feb<br />
7-Feb<br />
8-Feb<br />
Daily Market Report<br />
Saudi Arabia Stock Exchange<br />
9 February 2016<br />
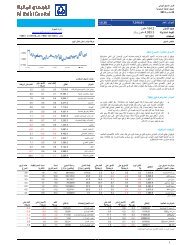
TASI Index 6,967.4 -1.01%<br />
Turnover (SAR mn) 4,415.6 10%<br />
TASI Intra Day Movement<br />
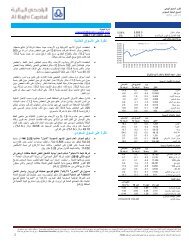
Global commentary<br />
Research Department<br />
research@alrajhi-capital.com<br />
Tel:+966 11 211 9370<br />
7,060<br />
7,040<br />
7,020<br />
7,000<br />
6,980<br />
6,960<br />
6,940<br />
6,920<br />
Intraday<br />
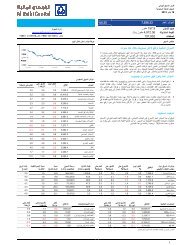
TASI – Activity Trend (Last 10 Days)<br />
-<br />
6<br />
4<br />
2<br />
Turnover (LHS, SAR bn)<br />
Previous Close<br />
TASI Index (RHS)<br />
9,000<br />
8,500<br />
8,000<br />
7,500<br />
7,000<br />
6,500<br />
6,000<br />
5,500<br />
5,000<br />
Regional Indices<br />
Close 1D% WTD% YTD%<br />
KSA (TASI) 6,967 -1.0 -1.8 -3.4<br />
Qatar (DSM) 10,654 0.7 0.8 2.1<br />
Kuw ait (KSE) 6,656 1.1 -2.7 15.8<br />
Abu Dhabi (ADSM) 4,574 0.6 2.9 0.6<br />
Dubai (DFM) 3,726 0.2 2.8 5.5<br />
Oman (MSM30) 5,828 0.1 0.4 0.8<br />
Bahrain (BSE) 1,310 0.0 0.2 7.3<br />
MSCI GCC 478 -0.2 -0.3 0.3<br />
Major Commodities / Currencies<br />
Close 1D % WTD % YTD %<br />
Gold Spot $/Oz 1,241 0.0 1.7 7.7<br />
Silver Spot $/Oz 17.79 0.1 1.6 11.8<br />
Crude Oil (Brent) 55.39 0.5 -2.5 -3.7<br />
OPEC Basket 52.78 -1.8 -2.7 -1.0<br />
Euro 1.07 -0.1 -0.9 1.6<br />
USD Index 100.29 0.0 0.4 -1.9<br />
JPY 112.170 -0.4 0.4 4.3<br />
Major Global Indices<br />
Close 1D % WTD % YTD %<br />
DJ Industrial 20,054 -0.2 -0.1 1.5<br />
S&P 500 2,295 0.1 -0.1 2.5<br />
Nikkei 225 18,925 -0.4 0.0 -1.0<br />
Hang seng 23,576 0.4 1.9 7.2<br />
FTSE 100 7,189 0.0 0.0 0.6<br />
CAC 40 4,767 0.3 -1.2 -2.0<br />
MSCI World 1,802 0.3 -0.2 2.9<br />
MSCI EM 922 0.2 0.3 6.9<br />
<br />
<br />
<br />
<br />
<br />
US stock markets advanced on Wednesday, driven by positive<br />
corporate earnings coupled with the rise in oil prices. The Nasdaq<br />
Composite Index rose 0.2%, closing at a record high for the second<br />
session in a row, while the S&P 500 edged up 0.1%, driven by<br />
utilities and real estate sectors. However, the Dow Jones fell 0.2%,<br />
led by financial stocks.<br />
European markets ended on a mixed note on Wednesday. The CAC<br />
40 gained 0.3%, backed by strong corporate earnings of Vinci and<br />
Sanofi, whereas the DAX fell 0.1%, led by basic resources,<br />
construction and chemical sectors. Meanwhile, the FTSE 100 ended<br />
on a flat note, as investors were cautious ahead of the key vote in the<br />
British parliament over the Brexit bill.<br />
Most GCC markets gained yesterday. Kuwait climbed 1.1%, while<br />
Qatar rose 0.7%, as Barwa Real Estate posted strong corporate<br />
earnings. Further, Abu Dhabi jumped 0.6%, driven by energy stocks,<br />
while Dubai and Oman added 0.2% and 0.1%, respectively.<br />
Meanwhile, Bahrain ended the session on a flat note.<br />
Most Asian markets are trading in the green this morning, tracking<br />
positive cues from the US. The Shanghai Composite Index and the<br />
Hang Seng Index are up 0.4% each, while the KOSPI is trading up<br />
0.2%. However, the Nikkei 225 is trading down 0.3%, backed by the<br />
stronger yen.<br />
Brent crude edged up 0.1% on Wednesday, as investors brushed<br />
aside the EIA report suggesting second-largest weekly rise in US<br />
crude oil inventory. Key crude contracts Brent and WTI ended at<br />
US$ 55.12 (+0.1%) and US$ 52.34 (+0.3%), respectively.<br />
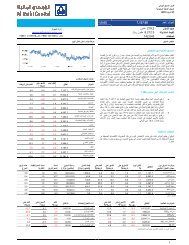
Saudi commentary<br />
<br />
<br />
<br />
<br />
Tadawul All Share Index (TASI) lost 71.22 point or 1.01 % to<br />
close at 6,967.40. Seventeen of the twenty sector indices closed<br />
lower. The advance decline ratio was 18/150. Trading turnover was<br />
around SAR 4.4bn.<br />
Saudi Cement board proposes dividend for H216: The board<br />
of directors of Saudi Cement Co. on Wednesday proposed issuing a<br />
27.5 percent cash dividend (SAR 2.75 per share) for the second half<br />
2016. (Argaam)<br />
Dallah Healthcare inks MoU to build hospital in North<br />
Jeddah: Dallah Healthcare Co. has signed an agreement with<br />
Raeda Investment Co. to set up a company to build and operate a<br />
general hospital in North Jeddah after obtaining necessary licenses,<br />
Dallah said in a statement to Tadawul Wednesday.(Argaam)<br />
Red Sea subsidiary to build SAR 63 mln staff housing in<br />
Malaysia: Red Sea Housing Services Co.’s Malaysian subsidiary has<br />
signed with Desaru Development Holdings One Sdn Bhd a letter of<br />
acceptance (LOA) at a total value of SAR 62.8 million (MYR 74.3<br />
million) to build an integrated staff village in Johor.(Argaam)<br />
Interest Rates<br />
1M 3M 12M 3M Chg 1Y<br />
LIBOR (USD) 0.77 1.04 1.71 0.42<br />
SAIBOR 1.69 1.96 2.34 0.23<br />
EIBOR 0.97 1.40 2.10 0.34<br />
Data Sources: Bloomberg<br />
Updated as of 09/Feb/2017 7:59 AM<br />
Please see penultimate page for additional important disclosures. Al Rajhi Capital (Al Rajhi) is a foreign broker-dealer unregistered in the USA. Al Rajhi research is prepared by research analysts<br />
who are not registered in the USA. Al Rajhi research is distributed in the USA pursuant to Rule 15a-6 of the Securities Exchange Act of 1934 solely by Rosenblatt Securities, an SEC registered and<br />
FINRA-member broker-dealer. 1
Energy<br />
Health Care<br />
Equipment & Svc<br />
Consumer Services<br />
Transport<br />
Food & Staples<br />
Retailing<br />
Diversified<br />
Financials<br />
Commercial &<br />
Professional Svc<br />
Pharma<br />
Consumer Durables<br />
& Apparel<br />
Media<br />
Daily Market Report<br />
Saudi Arabia Stock Exchange<br />
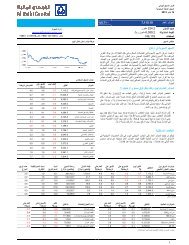
TASI – Large Cap (>10% Index weight) Sectors’ Performance<br />
TASI – Top Gainers / Losers<br />
0.0<br />
-0.5<br />
-1.0<br />
-1.5<br />
-2.0<br />
-2.5<br />
-3.0<br />
-3.5<br />
1D % (LHS) MTD % (LHS) YTD % (RHS)<br />
TASI Materials Banks Real<br />
Estate<br />
Telecom<br />
0.0<br />
-1.0<br />
-2.0<br />
-3.0<br />
-4.0<br />
-5.0<br />
-6.0<br />
-7.0<br />
-8.0<br />
-9.0<br />
-10.0<br />
Company Last Price Chg % Vol (mn) Value Trd (SAR mn)<br />
Al-Ahlia Coop Ins 6.93 9.7 11.966 79.59<br />
Solidarity Saudi 10.47 4.2 13.981 144.66<br />
Malath Insurance 8.76 3.7 3.812 32.96<br />
Saudi Enaya Coop 18.28 2.7 2.992 55.50<br />
Amana Coop Ins 9.22 2.7 5.299 48.55<br />
Company Last Price Chg % Vol (mn) Value Trd (SAR mn)<br />
Wataniya Ins 32.6 -5.3 1.126 37.48<br />
Sabb Takaful 30.4 -4.5 0.768 23.76<br />
Aljazira Takaful 31.7 -4.1 0.617 19.77<br />
Axa Cooperative 19.4 -4.1 2.600 51.36<br />
Sipchem 18.2 -3.7 1.030 18.89<br />
TASI – Mid Cap (5 -10% index weight) Sectors’ Performance<br />
TASI – Top Index Movers / Losers (Heavy weight stocks)<br />
6.0<br />
5.0<br />
4.0<br />
3.0<br />
2.0<br />
1.0<br />
0.0<br />
-1.0<br />
-2.0<br />
-3.0<br />
Insurance<br />
1D % (LHS) MTD % (LHS) YTD % (RHS)<br />
Food &<br />
Beverages<br />
Capital<br />
Goods<br />
Utilities<br />
Retailing<br />
6.0<br />
4.0<br />
2.0<br />
0.0<br />
-2.0<br />
-4.0<br />
-6.0<br />
Company Last Price Chg % Index Imp Value Trd (SAR mn)<br />
Saudi Elec 23.38 1.5 2.5 5.46<br />
Savola 38.38 1.4 2.1 0.33<br />
Emaar Eco City 18.64 2.0 1.1 2.82<br />
Makkah Const 90.25 0.8 0.8 0.05<br />
Al Othaim 102.69 1.2 0.4 0.09<br />
Company Last Price Chg % Index Imp Value Trd (SAR mn)<br />
Jabal Omar 67.27 -2.1 -8.2 10.04<br />
Samba 21.13 -2.9 -6.3 16.83<br />
Sabic 95.57 -0.8 -5.1 279.27<br />
Almarai 67.02 -1.4 -2.9 15.85<br />
STC 65.21 -1.2 -2.6 30.22<br />
TASI – Small Cap (
26-Jan<br />
26-Jan<br />
26-Jan<br />
29-Jan<br />
29-Jan<br />
29-Jan<br />
30-Jan<br />
30-Jan<br />
30-Jan<br />
31-Jan<br />
31-Jan<br />
31-Jan<br />
1-Feb<br />
1-Feb<br />
1-Feb<br />
2-Feb<br />
2-Feb<br />
2-Feb<br />
5-Feb<br />
5-Feb<br />
5-Feb<br />
6-Feb<br />
6-Feb<br />
6-Feb<br />
7-Feb<br />
7-Feb<br />
7-Feb<br />
8-Feb<br />
8-Feb<br />
8-Feb<br />
DFM<br />
ADSM<br />
DSM<br />
Real Estate<br />
Bank<br />
Bank<br />
Energy<br />
Reality<br />
Telecome<br />
Telecom<br />
Insurance<br />
Banks<br />
Consumer<br />
Fin.Services<br />
Investment<br />
Industrial<br />
Transport<br />
Transport<br />
Services<br />
Real Estate<br />
Telcom<br />
Insurance<br />
Consumer<br />
Services<br />
Insurance<br />
Daily Market Report<br />
Saudi Arabia Stock Exchange<br />
Performance of Regional markets<br />
Country<br />
Last Index Change (%) MCap Volume Turnover P/E (x) P/E (x) P/E (x) P/B (x) Div Yld<br />
Close 1D 1M YTD US$ bn mn shr US$ mn 12M 2016 2017E Current 12M (%)<br />
Saudi Arabia 6,967 -1.0 -1.9 -3.4 435 231 1,177 17.2 14.2 12.7 1.6 3.4<br />
Qatar 10,654 0.7 0.5 2.1 134 9.5 87 15.5 13.1 11.6 1.6 3.8<br />
Dubai 3,726 0.2 2.3 5.5 86 429 161 12.4 10.7 9.4 1.3 3.6<br />
Abu Dhabi 4,574 0.6 0.6 0.6 119 107 58 11.9 12.0 10.6 1.4 5.3<br />
Kuw ait 6,656 1.1 -2.6 15.8 96 593 159 22.9 NA NA 1.2 3.6<br />
Oman 5,828 0.1 0.9 0.8 17 14 7 10.9 9.7 9.7 1.2 4.9<br />
Bahrain 1,310 0.0 0.5 7.3 20 2.7 1 9.4 NA NA 0.4 4.3<br />
Data Sources: Al Rajhi Capital, Bloomberg<br />
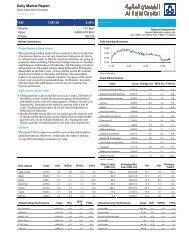
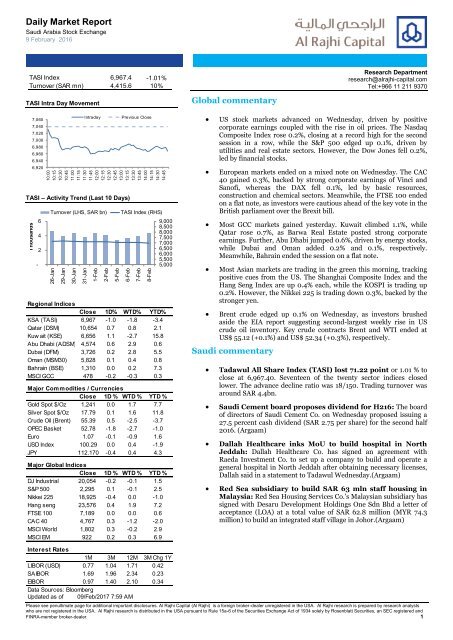
Dubai – Activity Trend (Last 10 Days) Dubai – Sector Performances Dubai – Top Gainers / Losers<br />
1.6<br />
1.2<br />
0.8<br />
0.4<br />
0.0<br />
Turnover (LHS, AED bn)<br />
DFMGI Index (RHS)<br />
3,740<br />
3,720<br />
3,700<br />
3,680<br />
3,660<br />
3,640<br />
3,620<br />
3,600<br />
3,580<br />
3,560<br />
5.0<br />
0.0<br />
-5.0<br />
1D % (LHS) MTD % (LHS) YTD % (RHS) Company Last Price Change % Vol (mn)<br />
Dubai Islamic Ins 1.09 9.0 36.82<br />
Takaful House 1.22 7.0 5.94<br />
Islamic Arab Ins 0.62 4.6 55.06<br />
Emaar Prop 7.58 1.5 11.13<br />
DXB Entertainments 1.17 0.9 49.05<br />
14.0<br />
12.0<br />
10.0<br />
8.0<br />
6.0<br />
4.0<br />
2.0<br />
0.0<br />
-2.0<br />
-4.0<br />
Company Last Price Change % Vol (mn)<br />
Union Properties 1.13 -1.7 24.43<br />
Drake & Scull Intl 0.53 -1.7 72.71<br />
Amanat Holdings 1.20 -1.6 23.20<br />
Damac Properties 0.45 -1.4 16.29<br />
Amlak Finance 1.31 -0.8 6.50<br />
Abu Dhabi – Activity Trend (Last 10 Days) Abu Dhabi – Sector Performances<br />
Abu Dhabi – Top Gainers / Losers<br />
0.5<br />
0.0<br />
Turnover (LHS, AED bn)<br />
ADSMI Index (RHS)<br />
5,000<br />
4,500<br />
4,000<br />
3.0<br />
2.0<br />
1.0<br />
0.0<br />
-1.0<br />
-2.0<br />
-3.0<br />
-4.0<br />
1D % (LHS) MTD % (LHS) YTD % (RHS) Company Last Price Change % Vol (mn)<br />
20.0 National Takaful 0.63 14.6 0.050<br />
Union Cement 1.29 8.4 0.025<br />
15.0<br />
Intl Fish Farming 2.28 6.1 16.862<br />
10.0<br />
Al Khazna Ins 0.44 4.8 0.920<br />
Methaq Takaful 0.94 3.3 12.629<br />
5.0<br />
0.0<br />
-5.0<br />
-10.0<br />
Company Last Price Change % Vol (mn)<br />
Abu Dhabi Aviati 2.90 -3.3 0.127<br />
Arkan Building Mat 0.89 -2.2 3.531<br />
Bank Of Sharjah 1.45 -1.4 0.337<br />
Agthia Group 6.76 -1.3 0.024<br />
Eshraq Propertie 1.12 -0.9 11.516<br />
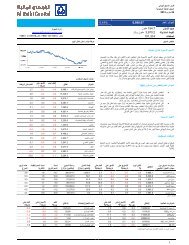
Qatar – Activity Trend (Last 10 Days) Qatar – Sector Performances Qatar – Top Gainers / Losers<br />
0.6<br />
0.3<br />
0.0<br />
Turnover (LHS, QAR bn)<br />
DSM Index (RHS)<br />
11,200<br />
10,800<br />
10,400<br />
10,000<br />
3.0<br />
2.5<br />
2.0<br />
1.5<br />
1.0<br />
0.5<br />
0.0<br />
-0.5<br />
-1.0<br />
-1.5<br />
-2.0<br />
-2.5<br />
1D % (LHS) MTD % (LHS) YTD % (RHS) Company Last Price Change % Vol (mn)<br />
Barw a Real Est 38.70 8.3 2.587<br />
CBQ 33.05 3.3 0.277<br />
Doha Bank 38.00 2.7 0.391<br />
Ind Qatar 112.50 1.4 0.087<br />
Mas Al Rayan 41.50 1.1 1.592<br />
7.0<br />
6.0<br />
5.0<br />
4.0<br />
3.0<br />
2.0<br />
1.0<br />
0.0<br />
-1.0<br />
-2.0<br />
-3.0<br />
-4.0<br />
Company Last Price Change % Vol (mn)<br />
United Devt Co 21.88 -3.0 0.513<br />
Mazaya Qatar 14.23 -1.9 0.207<br />
Qatar Navigation 93.50 -0.5 0.035<br />
Qatary investors 54.80 -0.4 0.004<br />
Qatar Insurance 83.50 -0.4 0.159<br />
Data Sources: Al Rajhi Capital, Bloomberg<br />
Disclosures Please refer to the important disclosures at the back of this report. 3
<strong>Thousands</strong><br />
<strong>Thousands</strong><br />
26-Jan<br />
26-Jan<br />
26-Jan<br />
29-Jan<br />
29-Jan<br />
29-Jan<br />
30-Jan<br />
30-Jan<br />
30-Jan<br />
31-Jan<br />
31-Jan<br />
31-Jan<br />
1-Feb<br />
1-Feb<br />
1-Feb<br />
2-Feb<br />
2-Feb<br />
2-Feb<br />
5-Feb<br />
5-Feb<br />
5-Feb<br />
6-Feb<br />
6-Feb<br />
6-Feb<br />
7-Feb<br />
7-Feb<br />
7-Feb<br />
8-Feb<br />
8-Feb<br />
8-Feb<br />
KSE<br />
BSE<br />
Technology<br />
Investment<br />
Banks<br />
Industrial<br />
Real estate<br />
Hotel & Tourism<br />
Bank<br />
Fin. Services<br />
Parallel<br />
Insurance<br />
Services<br />
Telecom<br />
Industries<br />
Consumer<br />
Insurance<br />
Services<br />
Basic material<br />
Oil&Gas<br />
Healthcare<br />
Daily Market Report<br />
Saudi Arabia Stock Exchange<br />
Kuwait – Activity Trend (Last 10 Days) Kuwait – Sector Performances Kuwait – Top Gainers / Losers<br />
80<br />
70<br />
60<br />
50<br />
40<br />
30<br />
20<br />
10<br />
0<br />
Turnover (LHS, KWD mn)<br />
KWSEIDX Index (RHS)<br />
7,000<br />
6,900<br />
6,800<br />
6,700<br />
6,600<br />
6,500<br />
6,400<br />
4.0<br />
2.0<br />
0.0<br />
-2.0<br />
-4.0<br />
-6.0<br />
-8.0<br />
-10.0<br />
-12.0<br />
-14.0<br />
1D % (LHS) MTD % (LHS) YTD % (RHS) Company Last Price Change % Vol (mn)<br />
35.0 National Consumer 50 17.7 0.003<br />
30.0 Real Estate Asset Mgmt 250 13.6 3.600<br />
Hets Telecom 55 10.0 1.380<br />
25.0<br />
Al Salam Group Hldg 56 9.8 8.171<br />
20.0 Yiaco Medical Co 280 9.8 0.001<br />
15.0<br />
10.0<br />
5.0<br />
0.0<br />
-5.0<br />
Company Last Price Change % Vol (mn)<br />
Hayat Communications 99 -8.3 0.235<br />
Ikarus Petroleum 33 -7.0 5.367<br />
Kuw ait Foundry 320 -5.9 0.242<br />
United Real Estate 100 -5.7 0.252<br />
First Dubai Real Est 74 -5.1 2.168<br />
Oman – Activity Trend (Last 10 Days) Oman – Sector Performances Oman – Top Gainers / Losers<br />
8<br />
4<br />
0<br />
Turnover (LHS, OMR mn)<br />
MSM30 Index (RHS)<br />
5,840<br />
5,820<br />
5,800<br />
5,780<br />
5,760<br />
5,740<br />
5,720<br />
5,700<br />
2.5<br />
2.0<br />
1.5<br />
1.0<br />
0.5<br />
0.0<br />
-0.5<br />
1D % (LHS) MTD % (LHS) YTD % (RHS) Company Last Price Change % Vol (mn)<br />
6.0<br />
Al-Anw ar Ceramic 0.169 2.4 4.932<br />
5.0 Bank Nizw a 0.089 1.1 3.948<br />
4.0 Al Batinah Pow er 0.189 1.1 0.007<br />
3.0 Oman Telecom 1.435 0.4 0.115<br />
2.0<br />
NA NA NA NA<br />
MSM 30 Bank Industry Services<br />
1.0<br />
0.0<br />
-1.0<br />
-2.0<br />
Company Last Price Change % Vol (mn)<br />
Al Anw ar Holding 0.186 -1.6 0.170<br />
Phoenix Pow er 0.144 -1.4 0.015<br />
Renaissance Serv 0.241 -1.2 0.150<br />
Al Sharqiya Inv 0.139 -0.7 0.053<br />
Oman Invest &Fin 0.216 -0.5 0.692<br />
Bahrain – Activity Trend (Last 10 Days) Bahrain – Sector Performances Bahrain – Top Gainers / Losers<br />
4.5<br />
4.0<br />
3.5<br />
3.0<br />
2.5<br />
2.0<br />
1.5<br />
1.0<br />
0.5<br />
-<br />
Turnover (LHS, BHD mn)<br />
BHSEASI Index (RHS)<br />
1,315<br />
1,310<br />
1,305<br />
1,300<br />
1,295<br />
1,290<br />
1,285<br />
2.0<br />
1.5<br />
1.0<br />
0.5<br />
0.0<br />
-0.5<br />
-1.0<br />
-1.5<br />
-2.0<br />
1D % (LHS) MTD % (LHS) YTD % (RHS)<br />
15.0<br />
10.0<br />
5.0<br />
0.0<br />
-5.0<br />
-10.0<br />
-15.0<br />
Company Last Price Change % Vol (mn)<br />
Ithmaar Bank 0.190 5.6 0.750<br />
Bahrain Islamic Bk 0.135 3.9 0.174<br />
Nass Corp 0.147 2.8 0.189<br />
BMMI 0.835 1.8 0.070<br />
Bahrain Comm Fac 0.665 1.5 0.020<br />
Company Last Price Change % Vol (mn)<br />
Khaleeji Com Bk 0.103 -2.8 0.420<br />
Al-Salam Bank 0.121 -2.4 0.065<br />
Ahli United Bk 0.710 -0.7 0.707<br />
NA NA NA NA<br />
NA NA NA NA<br />
Data Sources: Al Rajhi Capital, Bloomberg<br />
Disclosures Please refer to the important disclosures at the back of this report. 4
Daily Market Report<br />
Saudi Arabia Stock Exchange<br />
IMPORTANT DISCLOSURES FOR U.S. PERSONS<br />
This research report was prepared by Al Rajhi Capital (Al Rajhi), a company authorized to engage in securities activities in Saudi Arabia. Al<br />
Rajhi is not a registered broker-dealer in the United States and, therefore, is not subject to U.S. rules regarding the preparation of research<br />
reports and the independence of research analysts. This research report is provided for distribution to “major U.S. institutional investors” in<br />
reliance on the exemption from registration provided by Rule 15a-6 of the U.S. Securities Exchange Act of 1934, as amended (the<br />
“Exchange Act”).<br />
Any U.S. recipient of this research report wishing to effect any transaction to buy or sell securities or related financial instruments based on<br />
the information provided in this research report should do so only through Rosenblatt Securities Inc, 40 Wall Street 59th Floor, New York,<br />
NY 10005, a registered broker dealer in the United States. Under no circumstances should any recipient of this research report effect any<br />
transaction to buy or sell securities or related financial instruments through Al Rajhi. Rosenblatt Securities Inc. accepts responsibility for the<br />
contents of this research report, subject to the terms set out below, to the extent that it is delivered to a U.S. person other than a major U.S.<br />
institutional investor.<br />
The analyst whose name appears in this research report is not registered or qualified as a research analyst with the Financial Industry<br />
Regulatory Authority (“FINRA”) and may not be an associated person of Rosenblatt Securities Inc. and, therefore, may not be subject to<br />
applicable restrictions under FINRA Rules on communications with a subject company, public appearances and trading securities held by a<br />
research analyst account.<br />
Ownership and Material Conflicts of Interest<br />
Rosenblatt Securities Inc. or its affiliates does not ‘beneficially own,’ as determined in accordance with Section 13(d) of the Exchange Act,<br />
1% or more of any of the equity securities mentioned in the report. Rosenblatt Securities Inc, its affiliates and/or their respective officers,<br />
directors or employees may have interests, or long or short positions, and may at any time make purchases or sales as a principal or agent<br />
of the securities referred to herein. Rosenblatt Securities Inc. is not aware of any material conflict of interest as of the date of this<br />
publication.<br />
Compensation and Investment Banking Activities<br />
Rosenblatt Securities Inc. or any affiliate has not managed or co-managed a public offering of securities for the subject company in the past<br />
12 months, nor received compensation for investment banking services from the subject company in the past 12 months, neither does it or<br />
any affiliate expect to receive, or intends to seek compensation for investment banking services from the subject company in the next 3<br />
months.<br />
Additional Disclosures<br />
This research report is for distribution only under such circumstances as may be permitted by applicable law. This research report has no<br />
regard to the specific investment objectives, financial situation or particular needs of any specific recipient, even if sent only to a single<br />
recipient. This research report is not guaranteed to be a complete statement or summary of any securities, markets, reports or<br />
developments referred to in this research report. Neither Al Rajhi nor any of its directors, officers, employees or agents shall have any<br />
liability, however arising, for any error, inaccuracy or incompleteness of fact or opinion in this research report or lack of care in this research<br />
report’s preparation or publication, or any losses or damages which may arise from the use of this research report.<br />
Al Rajhi may rely on information barriers, such as “Chinese Walls” to control the flow of information within the areas, units, divisions, groups,<br />
or affiliates of Al Rajhi.<br />
Investing in any non-U.S. securities or related financial instruments (including ADRs) discussed in this research report may present certain<br />
risks. The securities of non-U.S. issuers may not be registered with, or be subject to the regulations of, the U.S. Securities and Exchange<br />
Commission. Information on such non-U.S. securities or related financial instruments may be limited. Foreign companies may not be<br />
subject to audit and reporting standards and regulatory requirements comparable to those in effect within the United States.<br />
The value of any investment or income from any securities or related financial instruments discussed in this research report denominated in<br />
a currency other than U.S. dollars is subject to exchange rate fluctuations that may have a positive or adverse effect on the value of or<br />
income from such securities or related financial instruments.<br />
Past performance is not necessarily a guide to future performance and no representation or warranty, express or implied, is made by Al<br />
Rajhi with respect to future performance. Income from investments may fluctuate. The price or value of the investments to which this<br />
research report relates, either directly or indirectly, may fall or rise against the interest of investors. Any recommendation or opinion<br />
contained in this research report may become outdated as a consequence of changes in the environment in which the issuer of the<br />
securities under analysis operates, in addition to changes in the estimates and forecasts, assumptions and valuation methodology used<br />
herein.<br />
No part of the content of this research report may be copied, forwarded or duplicated in any form or by any means without the prior consent<br />
of Al Rajhi and Al Rajhi accepts no liability whatsoever for the actions of third parties in this respectThis research document has been<br />
prepared by Al Rajhi Capital Company (“Al Rajhi Capital”) of Riyadh, Saudi Arabia. It has been prepared for the general use of Al Rajhi<br />
Capital’s clients and may not be redistributed, retransmitted or disclosed, in whole or in part, or in any form or manner, without the express<br />
written consent of Al Rajhi Capital. Receipt and review of this research document constitute your agreement not to redistribute, retransmit,<br />
or disclose to others the contents, opinions, conclusion, or information contained in this document prior to public disclosure of such<br />
information by Al Rajhi Capital. The information contained was obtained from various public sources believed to be reliable but we do not<br />
guarantee its accuracy. Al Rajhi Capital makes no representations or warranties (express or implied) regarding the data and information<br />
provided and Al Rajhi Capital does not represent that the information content of this document is complete, or free from any error, not<br />
misleading, or fit for any particular purpose. This research document provides general information only. Neither the information nor any<br />
opinion expressed constitutes an offer or an invitation to make an offer, to buy or sell any securities or other investment products related to<br />
such securities or investments. It is not intended to provide personal investment advice and it does not take into account the specific<br />
investment objectives, financial situation and the particular needs of any specific person who may receive this document.<br />
Investors should seek financial, legal or tax advice regarding the appropriateness of investing in any securities, other investment or<br />
investment strategies discussed or recommended in this document and should understand that statements regarding future prospects may<br />
not be realized. Investors should note that income from such securities or other investments, if any, may fluctuate and that the price or value<br />
of such securities and investments may rise or fall. Fluctuations in exchange rates could have adverse effects on the value of or price of, or<br />
income derived from, certain investments. Accordingly, investors may receive back less than originally invested. Al Rajhi Capital or its<br />
officers or one or more of its affiliates (including research analysts) may have a financial interest in securities of the issuer(s) or related<br />
investments, including long or short positions in securities, warrants, futures, options, derivatives, or other financial instruments. Al Rajhi<br />
Capital or its affiliates may from time to time perform investment banking or other services for, solicit investment banking or other business<br />
from, any company mentioned in this research document. Al Rajhi Capital, together with its affiliates and employees, shall not be liable for<br />
any direct, indirect or consequential loss or damages that may arise, directly or indirectly, from any use of the information contained in this<br />
research document.<br />
This research document and any recommendations contained are subject to change without prior notice. Al Rajhi Capital assumes no<br />
responsibility to update the information in this research document. Neither the whole nor any part of this research document may be altered,<br />
duplicated, transmitted or distributed in any form or by any means. This research document is not directed to, or intended for distribution to<br />
or use by, any person or entity who is a citizen or resident of or located in any locality, state, country or other jurisdiction where such<br />
distribution, publication, availability or use would be contrary to law or which would subject Al Rajhi Capital or any of its affiliates to any<br />
registration or licensing requirement within such jurisdiction.<br />
5
Daily Market Report<br />
Saudi Arabia Stock Exchange<br />
Disclaimer and additional disclosures for Equity Research<br />
Disclaimer<br />
This research document has been prepared by Al Rajhi Capital Company (“Al Rajhi Capital”) of Riyadh, Saudi Arabia. It has been prepared<br />
for the general use of Al Rajhi Capital’s clients and may not be redistributed, retransmitted or disclosed, in whole or in part, or in any form or<br />
manner, without the express written consent of Al Rajhi Capital. Receipt and review of this research document constitute your agreement<br />
not to redistribute, retransmit, or disclose to others the contents, opinions, conclusion, or information contained in this document prior to<br />
public disclosure of such information by Al Rajhi Capital. The information contained was obtained from various public sources believed to be<br />
reliable but we do not guarantee its accuracy. Al Rajhi Capital makes no representations or warranties (express or implied) regarding the<br />
data and information provided and Al Rajhi Capital does not represent that the information content of this document is complete, or free<br />
from any error, not misleading, or fit for any particular purpose. This research document provides general information only. Neither the<br />
information nor any opinion expressed constitutes an offer or an invitation to make an offer, to buy or sell any securities or other investment<br />
products related to such securities or investments. It is not intended to provide personal investment advice and it does not take into account<br />
the specific investment objectives, financial situation and the particular needs of any specific person who may receive this document.<br />
Investors should seek financial, legal or tax advice regarding the appropriateness of investing in any securities, other investment or<br />
investment strategies discussed or recommended in this document and should understand that statements regarding future prospects may<br />
not be realized. Investors should note that income from such securities or other investments, if any, may fluctuate and that the price or value<br />
of such securities and investments may rise or fall. Fluctuations in exchange rates could have adverse effects on the value of or price of, or<br />
income derived from, certain investments. Accordingly, investors may receive back less than originally invested. Al Rajhi Capital or its<br />
officers or one or more of its affiliates (including research analysts) may have a financial interest in securities of the issuer(s) or related<br />
investments, including long or short positions in securities, warrants, futures, options, derivatives, or other financial instruments. Al Rajhi<br />
Capital or its affiliates may from time to time perform investment banking or other services for, solicit investment banking or other business<br />
from, any company mentioned in this research document. Al Rajhi Capital, together with its affiliates and employees, shall not be liable for<br />
any direct, indirect or consequential loss or damages that may arise, directly or indirectly, from any use of the information contained in this<br />
research document.<br />
This research document and any recommendations contained are subject to change without prior notice. Al Rajhi Capital assumes no<br />
responsibility to update the information in this research document. Neither the whole nor any part of this research document may be altered,<br />
duplicated, transmitted or distributed in any form or by any means. This research document is not directed to, or intended for distribution to<br />
or use by, any person or entity who is a citizen or resident of or located in any locality, state, country or other jurisdiction where such<br />
distribution, publication, availability or use would be contrary to law or which would subject Al Rajhi Capital or any of its affiliates to any<br />
registration or licensing requirement within such jurisdiction.<br />
Explanation of Al Rajhi Capital’s rating system<br />
Al Rajhi Capital uses a three-tier rating system based on absolute upside or downside potential for all stocks under its coverage except<br />
financial stocks and those few other companies not compliant with Islamic Shariah law:<br />
"Overweight": Our target price is more than 10% above the current share price, and we expect the share price to reach the target on a 12<br />
month time horizon.<br />
"Neutral": We expect the share price to settle at a level between 10% below the current share price and 10% above the current share price<br />
on a 12 month time horizon.<br />
"Underweight": Our target price is more than 10% below the current share price, and we expect the share price to reach the target on a 12<br />
month time horizon.<br />
"Target price": We estimate target value per share for every stock we cover. This is normally based on widely accepted methods<br />
appropriate to the stock or sector under consideration, e.g. DCF (discounted cash flow) or SoTP (sum of the parts) analysis.<br />
Please note that the achievement of any price target may be impeded by general market and economic trends and other external factors, or<br />
if a company’s profits or operating performance exceed or fall short of our expectations.<br />
Contact us<br />
Al Rajhi Capital<br />
Research Department<br />
Head Office, King Fahad Road<br />
P.O. Box 5561, Riyadh 11432<br />
Kingdom of Saudi Arabia<br />
Email: research@alrajhi-capital.com<br />
Al Rajhi Capital is licensed by the Saudi Arabian Capital Market Authority, License No. 07068/37.<br />
6