

Contents
PDP-2017-2022-Prepublication
PDP-2017-2022-Prepublication

You also want an ePaper? Increase the reach of your titles
YUMPU automatically turns print PDFs into web optimized ePapers that Google loves.
Basic Education<br />
Enrolment rates increased but targets were missed. An institutionalized kindergarten<br />
pushed enrolment to as high as 79 percent, which could have been higher if not for a change in<br />
age requirement. At the elementary level, most recent data showed that net enrolment rate<br />
(NER) reached 91 percent in school year (SY) 2015-2016. Annual data for NER may not be<br />
compared because of recent improvements in tracking learners through the use of the Learner<br />
Information System (LIS). NER at the secondary level increased from 64.70 percent in 2010 to<br />
68.15 percent in 2015. Enrolment in the first year of Senior High School (SHS) 10 in 2016 was<br />
higher than anticipated. The support extended to learners played an important role in this<br />
outcome, with 715,337 Grade 11 learners availing of the voucher program.<br />
Raising the quality of education remained a challenge. Elementary and secondary<br />
achievement rates stayed low, and this is indicative of the low quality of education.<br />
Contributing to this was a lack of teacher competencies, 11 high student-teacher ratios, absence<br />
of basic educational facilities, and the quality of classrooms.<br />
Efficiency improved at the elementary level, with mixed results at the secondary level.<br />
Completion rates (CompR) and cohort survival rates (CSR) at the elementary level improved.<br />
At the secondary level, while CSR increased during the same period, CompR decreased<br />
significantly in SY 2015-2016. The decline in CompR may be due to students’ lack of personal<br />
interest, need to look for work, and insufficient family income. 12 Moreover, among the out-ofschool<br />
children and youth 6 to 24 years old, marriage was the most common reason for not<br />
attending school.<br />
Drop-out rates decreased from 6.29 percent in SY 2010-2011 to 2.70 percent in SY 2015-2016<br />
at the elementary level and from 7.79 percent to 6.65 percent at the secondary<br />
level. Comparison between sexes, however, showed that more boys were unable to finish<br />
school than girls. Drop-out rates for males was at 0.65 percent and 3.32 percent in the<br />
elementary and secondary levels, respectively, compared with girls at 0.36 percent and 1.64<br />
percent.<br />
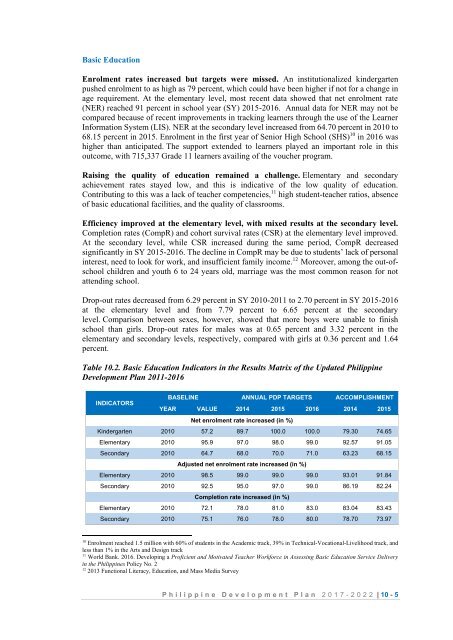
Table 10.2. Basic Education Indicators in the Results Matrix of the Updated Philippine<br />
Development Plan 2011-2016<br />
BASELINE ANNUAL PDP TARGETS ACCOMPLISHMENT<br />
INDICATORS<br />
YEAR VALUE 2014 2015 2016 2014 2015<br />
Net enrolment rate increased (in %)<br />
Kindergarten 2010 57.2 89.7 100.0 100.0 79.30 74.65<br />
Elementary 2010 95.9 97.0 98.0 99.0 92.57 91.05<br />
Secondary 2010 64.7 68.0 70.0 71.0 63.23 68.15<br />
Adjusted net enrolment rate increased (in %)<br />
Elementary 2010 98.5 99.0 99.0 99.0 93.01 91.84<br />
Secondary 2010 92.5 95.0 97.0 99.0 86.19 82.24<br />
Completion rate increased (in %)<br />
Elementary 2010 72.1 78.0 81.0 83.0 83.04 83.43<br />
Secondary 2010 75.1 76.0 78.0 80.0 78.70 73.97<br />
10<br />
Enrolment reached 1.5 million with 60% of students in the Academic track, 39% in Technical-Vocational-Livelihood track, and<br />
less than 1% in the Arts and Design track<br />
11<br />
World Bank. 2016. Developing a Proficient and Motivated Teacher Workforce in Assessing Basic Education Service Delivery<br />
in the Philippines Policy No. 2<br />
12<br />
2013 Functional Literacy, Education, and Mass Media Survey<br />
P h i l i p p i n e D e v e l o p m e n t P l a n 2 0 1 7 - 2 0 2 2 | 10 - 5