

Contents
PDP-2017-2022-Prepublication
PDP-2017-2022-Prepublication

Create successful ePaper yourself
Turn your PDF publications into a flip-book with our unique Google optimized e-Paper software.
Furthermore, updating the National Urban Development and Housing Framework (NUDHF)<br />
2017-2022 is a good opportunity to re-evaluate the urban framework, align it with the NUA<br />
and PDP, and develop forward-looking responses to the challenges confronting Philippine<br />
human settlements.<br />
Strategic Framework<br />
Under the pillar Pagbabago or reducing inequality, the PDP 2017-2022 aims to strengthen<br />
socioeconomic resilience by building safe and secure communities. This chapter focuses on<br />
expanding access to affordable, adequate, safe, and secure shelter in well-planned communities.<br />
Targets<br />
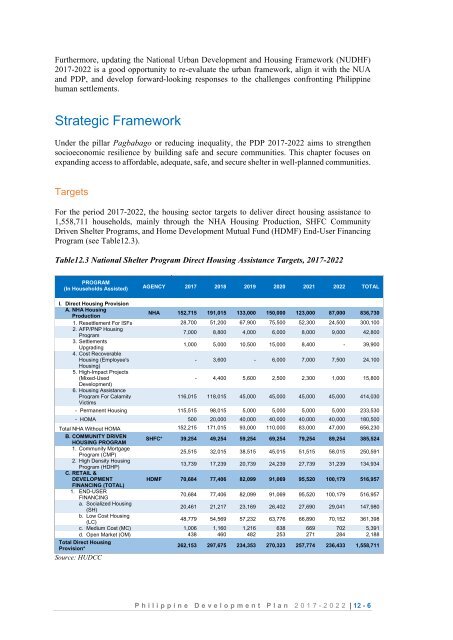
For the period 2017-2022, the housing sector targets to deliver direct housing assistance to<br />
1,558,711 households, mainly through the NHA Housing Production, SHFC Community<br />
Driven Shelter Programs, and Home Development Mutual Fund (HDMF) End-User Financing<br />
Program (see Table12.3).<br />
Table12.3 National Shelter Program Direct Housing Assistance Targets, 2017-2022<br />
PROGRAM<br />
(In Households Assisted)<br />
AGENCY 2017 2018 2019 2020 2021 2022 TOTAL<br />
I. Direct Housing Provision<br />
A. NHA Housing<br />
Production<br />
NHA 152,715 191,015 133,000 150,000 123,000 87,000 836,730<br />
1. Resettlement For ISFs 28,700 51,200 67,900 75,500 52,300 24,500 300,100<br />
2. AFP/PNP Housing<br />
Program<br />
7,000 8,800 4,000 6,000 8,000 9,000 42,800<br />
3. Settlements<br />
Upgrading<br />
1,000 5,000 10,500 15,000 8,400 - 39,900<br />
4. Cost Recoverable<br />
Housing (Employee's<br />
- 3,600 - 6,000 7,000 7,500 24,100<br />
Housing)<br />
5. High-Impact Projects<br />
(Mixed-Used<br />
- 4,400 5,600 2,500 2,300 1,000 15,800<br />
Development)<br />
6. Housing Assistance<br />
Program For Calamity<br />
Victims<br />
116,015 118,015 45,000 45,000 45,000 45,000 414,030<br />
- Permanent Housing 115,515 98,015 5,000 5,000 5,000 5,000 233,530<br />
- HOMA 500 20,000 40,000 40,000 40,000 40,000 180,500<br />
Total NHA Without HOMA 152,215 171,015 93,000 110,000 83,000 47,000 656,230<br />
B. COMMUNITY DRIVEN<br />
HOUSING PROGRAM<br />
SHFC* 39,254 49,254 59,254 69,254 79,254 89,254 385,524<br />
1. Community Mortgage<br />
Program (CMP)<br />
25,515 32,015 38,515 45,015 51,515 58,015 250,591<br />
2. High Density Housing<br />
Program (HDHP)<br />
13,739 17,239 20,739 24,239 27,739 31,239 134,934<br />
C. RETAIL &<br />
DEVELOPMENT<br />
HDMF 70,684 77,406 82,099 91,069 95,520 100,179 516,957<br />
FINANCING (TOTAL)<br />
1. END-USER<br />
FINANCING<br />
70,684 77,406 82,099 91,069 95,520 100,179 516,957<br />
a. Socialized Housing<br />
(SH)<br />
20,461 21,217 23,169 26,402 27,690 29,041 147,980<br />
b. Low Cost Housing<br />
(LC)<br />
48,779 54,569 57,232 63,776 66,890 70,152 361,398<br />
c. Medium Cost (MC) 1,006 1,160 1,216 638 669 702 5,391<br />
d. Open Market (OM) 438 460 482 253 271 284 2,188<br />
Total Direct Housing<br />
Provision*<br />
262,153 297,675 234,353 270,323 257,774 236,433 1,558,711<br />
Source: HUDCC<br />
P h i l i p p i n e D e v e l o p m e n t P l a n 2 0 1 7 - 2 0 2 2 | 12 - 6