

Telework - Telenor
Telework - Telenor
Telework - Telenor

You also want an ePaper? Increase the reach of your titles
YUMPU automatically turns print PDFs into web optimized ePapers that Google loves.
sent 4.5 % of the workforce, that is approximately<br />
100,000 persons in Norway.<br />
In contrast to PT homeworkers, the number<br />
of ICT-based homeworkers has been<br />
constant at least for the last two years<br />
(from 1997 to 1998).<br />
The group of mobile workers, as defined<br />
above, is the largest category. The percent<br />
of the workforce who conduct more<br />
than five hours of paid work outside the<br />
office and the home is between 16 and<br />
17, and there are only minor changes<br />
over the period. It is however important<br />
to stress that this category includes more<br />
than the white-collar worker “on the run”<br />
with a lap-top under his arm and a cellular<br />
in his pocket. Mobile work, as it is<br />
defined here, also covers taxi drivers,<br />
truck drivers, sales people, construction<br />
workers and several other vocations.<br />
3.5 The typical teleworker<br />
Hypothesis two, presented above, stated<br />
that the teleworkers would have a relatively<br />
privileged status in the labor market.<br />
I will here look closer at the teleworkers’<br />
professions, status at work,<br />
income, gender and their family pattern.<br />
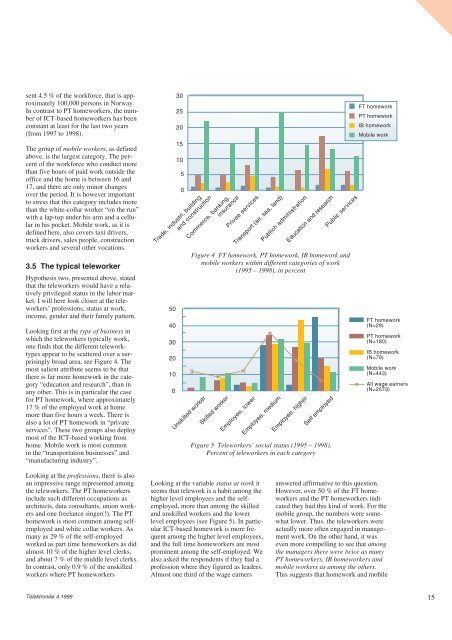
Looking first at the type of business in<br />
which the teleworkers typically work,<br />
one finds that the different teleworktypes<br />
appear to be scattered over a surprisingly<br />
broad area, see Figure 4. The<br />
most salient attribute seems to be that<br />
there is far more homework in the category<br />
“education and research”, than in<br />
any other. This is in particular the case<br />
for PT homework, where approximately<br />
17 % of the employed work at home<br />
more than five hours a week. There is<br />
also a lot of PT homework in “private<br />
services”. These two groups also deploy<br />
most of the ICT-based working from<br />
home. Mobile work is most common<br />
in the “transportation businesses” and<br />
“manufacturing industry”.<br />
Looking at the professions, there is also<br />
an impressive range represented among<br />
the teleworkers. The PT homeworkers<br />
include such different occupations as<br />
architects, data consultants, union workers<br />
and one freelance singer(!). The PT<br />
homework is most common among selfemployed<br />
and white collar workers. As<br />
many as 29 % of the self-employed<br />
worked as part time homeworkers as did<br />
almost 10 % of the higher level clerks,<br />
and about 7 % of the middle level clerks.<br />
In contrast, only 0.9 % of the unskilled<br />
workers where PT homeworkers<br />
Telektronikk 4.1999<br />
30<br />
25<br />
20<br />
15<br />
10<br />
5<br />
0<br />
Trade, industri, building<br />
and construction<br />
50<br />
40<br />
30<br />
20<br />
10<br />
0<br />
Unskilled worker<br />
Commerce, banking,<br />
insurance<br />
Skilled worker<br />
Privae services<br />
Transport (air, sea, land)<br />
Employee, lower<br />
Employee, medium<br />
Looking at the variable status at work it<br />
seems that telework is a habit among the<br />
higher level employees and the selfemployed,<br />
more than among the skilled<br />
and unskilled workers and the lower<br />
level employees (see Figure 5). In particular<br />
ICT-based homework is more frequent<br />
among the higher level employees,<br />
and the full time homeworkers are most<br />
prominent among the self-employed. We<br />
also asked the respondents if they had a<br />
profession where they figured as leaders.<br />
Almost one third of the wage earners<br />
Publich administration<br />
Education and research<br />
Employee, higher<br />
Self employed<br />
Public services<br />
Figure 4 FT homework, PT homework, IB homework and<br />
mobile workers within different categories of work<br />
(1995 – 1998), in percent<br />
Figure 5 <strong>Telework</strong>ers’ social status (1995 – 1998).<br />
Percent of teleworkers in each category<br />
FT homework<br />
PT homework<br />
IB homework<br />
Mobile work<br />
FT homework<br />
(N=29)<br />
PT homework<br />
(N=180)<br />
IB homework<br />
(N=79)<br />
Mobile work<br />
(N=443)<br />
All wage earners<br />
(N=2573)<br />
answered affirmative to this question.<br />
However, over 50 % of the FT homeworkers<br />
and the PT homeworkers indicated<br />
they had this kind of work. For the<br />
mobile group, the numbers were somewhat<br />
lower. Thus, the teleworkers were<br />
actually more often engaged in management<br />
work. On the other hand, it was<br />
even more compelling to see that among<br />
the managers there were twice as many<br />
PT homeworkers, IB homeworkers and<br />
mobile workers as among the others.<br />
This suggests that homework and mobile<br />
15


