- Page 1: Nanostructured, Electroactive and B
- Page 4 and 5: Dedications This dissertation is de
- Page 6 and 7: School of Biomedical Engineering, S
- Page 8 and 9: 2.2. Experimental .................
- Page 10 and 11: 5.2.2. Treatment of Substrate Surfa
- Page 12 and 13: 8.2. Electroactive, Bioapplicable M
- Page 14 and 15: List of Tables Table 2-1. Compositi
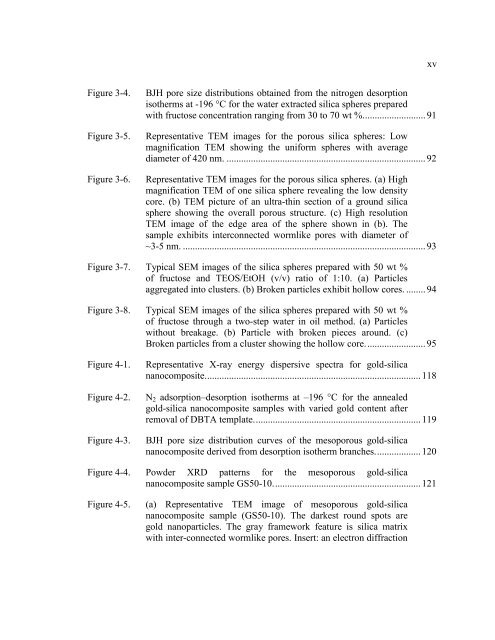
- Page 18 and 19: xvi pattern of gold nanoparticles i
- Page 20 and 21: xviii PANI under culturing conditio
- Page 22 and 23: Figure B-8. Cyclic voltammogram (Pt
- Page 24: The resultant polyaniline-collagen
- Page 27 and 28: Chapter 2 presents a study focused
- Page 29 and 30: Chapter 7 is focused on the synthes
- Page 31 and 32: surfactant templated method was ext
- Page 33 and 34: The porous structure of the silica
- Page 35 and 36: Before early 1990s, with a pore or
- Page 37 and 38: − Neutral surfactants: the hydrop
- Page 39 and 40: The mechanism of nonsurfactant temp
- Page 41 and 42: zero in a pore. Structural informat
- Page 43 and 44: 1.5.1. Gas Sorption Measurement As
- Page 45 and 46: which is usually associated with ca
- Page 47 and 48: 16. Iler, R. K. The Chemistry of Si
- Page 49 and 50: 52. Sayari, A.; Danumah, C.; Moudra
- Page 51 and 52: Figure 1-1. Three structure types p
- Page 53 and 54: Figure 1-3. IUPAC classification of
- Page 55 and 56: Chapter 2. Mesoporous Sol-Gel Mater
- Page 57 and 58: well formed below the isoelectric p
- Page 59 and 60: 2.1.2. Nonsurfactant Templates and
- Page 61 and 62: since controllable partial removal
- Page 63 and 64: were ground manually into fine powd
- Page 65 and 66: volatile sol-gel reaction byproduct
- Page 67 and 68:
After the thermal treatment at 150
- Page 69 and 70:
oiling point of benzoin (i.e., 194
- Page 71 and 72:
interconnected pores or channels wi
- Page 73 and 74:
6. Huo, Q.; Magargolese, D. I.; Cie
- Page 75 and 76:
Table 2-1. Composition and pore par
- Page 77 and 78:
Weight (%) 100 80 60 40 20 0 0 100
- Page 79 and 80:
Weight (%) 100 90 80 70 60 0 100 20
- Page 81 and 82:
Weight (%) 100 90 80 70 60 50 40 0
- Page 83 and 84:
Figure 2-7. Representative IR spect
- Page 85 and 86:
dV/dD Pore Volume (cm 3 g -1 Å -1
- Page 87 and 88:
dv/dD, Pore Volume (cm 3 g -1 Å -1
- Page 89 and 90:
Net Pore Volume (cm 3 g -1 ) 0.6 0.
- Page 91 and 92:
Chapter 3. Synthesis of Mesoporous
- Page 93 and 94:
preparation conditions. In general,
- Page 95 and 96:
cubic, as well as vesicular structu
- Page 97 and 98:
3.2 Experimental The synthesis appr
- Page 99 and 100:
3.2.3. Synthesis of Mesoporous Sphe
- Page 101 and 102:
fructose is incorporated into the s
- Page 103 and 104:
mainly attributed to the monolayer-
- Page 105 and 106:
with nonsurfactant templates at dif
- Page 107 and 108:
3.4. Conclusions and Remarks In the
- Page 109 and 110:
11. Matijević, E.; Gheradi, P. Tra
- Page 111 and 112:
41. Polarz, S.; Smarsly, B.; Bronst
- Page 113 and 114:
(a) (b) Figure 3-1. Typical SEM ima
- Page 115 and 116:
Volume Adsorbed (cm 3 g -1 , STP) 3
- Page 117 and 118:
Figure 3-5. Representative TEM imag
- Page 119 and 120:
(a) (b) Figure 3-7. Typical SEM ima
- Page 121 and 122:
Chapter 4. Synthesis of Mesoporous
- Page 123 and 124:
nm, and the reaction reaches the hi
- Page 125 and 126:
microemulsion. 39 Martino et al. re
- Page 127 and 128:
the colloidal gold sol was combined
- Page 129 and 130:
holders with adhesive carbon tape.
- Page 131 and 132:
trapped in the gold-silica matrix,
- Page 133 and 134:
108 The Barrett-Joyner-Halenda (BJH
- Page 135 and 136:
indicative of a well-defined crysta
- Page 137 and 138:
(i.e., 2-50 nm). Combining both hig
- Page 139 and 140:
19. Hayashi, T.; Tanaka, K.; Haruta
- Page 141 and 142:
53. Qi, L.; Ma, J.; Cheng, H.; Zhao
- Page 143 and 144:
Figure 4-1. Representative X-ray en
- Page 145 and 146:
Pore Volume (cm 3 g -1 A -1 ) 0.06
- Page 147 and 148:
(a) (b) 122 Figure 4-5. (a) Represe
- Page 149 and 150:
Absorbance Wavelength (nm) Figure 4
- Page 151 and 152:
5.1.1. Organic-Inorganic Nanocompos
- Page 153 and 154:
128 We are also interested in the p
- Page 155 and 156:
mica and graphite, the top layer wa
- Page 157 and 158:
mode. Scanning electron microscopy
- Page 159 and 160:
Waal’s forces), the agglomeration
- Page 161 and 162:
136 A single glass transition tempe
- Page 163 and 164:
5.5. Acknowledgments 138 I want to
- Page 165 and 166:
30. Dimitrov, A. S.; Nagayama, K. L
- Page 167 and 168:
(a) (b) 142 Figure 5-2. Representat
- Page 169 and 170:
144 Figure 5-4. Representative AFM
- Page 171 and 172:
Figure 5-6. Representative IR spect
- Page 173 and 174:
(a) (b) Figure 5-8. Representative
- Page 175 and 176:
the possibility of utilizing conduc
- Page 177 and 178:
iocompatibility and water solubilit
- Page 179 and 180:
emeraldine salt, the unique conduct
- Page 181 and 182:
acid (HCl, 37.3%, Fisher), hydrogen
- Page 183 and 184:
the surface of polymer coated cultu
- Page 185 and 186:
acidic acid aqueous solution showed
- Page 187 and 188:
oxidant, indicating the formation o
- Page 189 and 190:
complex was synthesized by pre-alig
- Page 191 and 192:
8. Epstein, A. J. Springer Ser. Mat
- Page 193 and 194:
45. Liu, J.-M.; Yang, S. Chem. Comm
- Page 195 and 196:
Figure 6-1. Schematics of biologica
- Page 197 and 198:
172 Figure 6-3. UV-Vis absorption s
- Page 199 and 200:
Figure 6-5. FT-IR spectra of (a) co
- Page 201 and 202:
176 Figure 6-7. UV-Vis absorption s
- Page 203 and 204:
(a) (b) 178 Figure 6-9. Comparison
- Page 205 and 206:
prepared and purified as substitute
- Page 207 and 208:
greatest advantages of organic mate
- Page 209 and 210:
een explored as a direct and effect
- Page 211 and 212:
if we could fine-tune the carrier t
- Page 213 and 214:
NMR (250 MHz, DCCl3) δ (ppm): 8.95
- Page 215 and 216:
7.2.4. Instrumentation and Characte
- Page 217 and 218:
The absence of the proton from the
- Page 219 and 220:
194 The absorbance at 600 nm is the
- Page 221 and 222:
L3Al dissociated to free ligand (L)
- Page 223 and 224:
198 State and Integrated Circuit Te
- Page 225 and 226:
34. Stossel, M.; Staudigel, J.; Ste
- Page 227 and 228:
Table 7-1. The UV absorbance at 600
- Page 229 and 230:
Figure 7-2. Schematic cross-section
- Page 231 and 232:
Figure 7-4. NMR Spectra of ligand 1
- Page 233 and 234:
Figure 7-6. FT-IR spectra of (a) li
- Page 235 and 236:
Figure 7-8. During air oxidation: 1
- Page 237 and 238:
[A] 1.2E-04 1.0E-04 8.0E-05 6.0E-05
- Page 239 and 240:
Figure 7-12. Mass spectrum of alumi
- Page 241 and 242:
Chapter 8. Concluding Remarks 216 T
- Page 243 and 244:
218 In contrast to the conventional
- Page 245 and 246:
properties of gold nanoparticles ma
- Page 247 and 248:
222 In an effort to obtain new elec
- Page 249 and 250:
as sensor units, the biodegradable
- Page 251 and 252:
polyanhydrides, 4 polyorthoesters,
- Page 253 and 254:
substitution reaction, several hund
- Page 255 and 256:
polyphosphazenes. Obtained material
- Page 257 and 258:
polyphosphazene network. Studies in
- Page 259 and 260:
matrix is readily formed due to the
- Page 261 and 262:
236 The delivery system can be made
- Page 263 and 264:
phosphazene main chains. Further in
- Page 265 and 266:
9. Allcock, H. R. Adv. Mater. 1994,
- Page 267 and 268:
Figure A-1. Repeating unit in polyp
- Page 269 and 270:
Figure A-3. Applications of materia
- Page 271 and 272:
Figure A-5. Preparation of poly(N-i
- Page 273 and 274:
B.3. Acknowledgments 248 I am grate
- Page 275 and 276:
Figure B-2. Cyclic voltammogram (Hg
- Page 277 and 278:
Figure B-4. Cyclic voltammogram (Pt
- Page 279 and 280:
Figure B-6. Cyclic voltammogram (Hg
- Page 281 and 282:
Figure B-8. Cyclic voltammogram (Pt