Practical Data for Metallurgists - Timken
Practical Data for Metallurgists - Timken
Practical Data for Metallurgists - Timken

You also want an ePaper? Increase the reach of your titles
YUMPU automatically turns print PDFs into web optimized ePapers that Google loves.
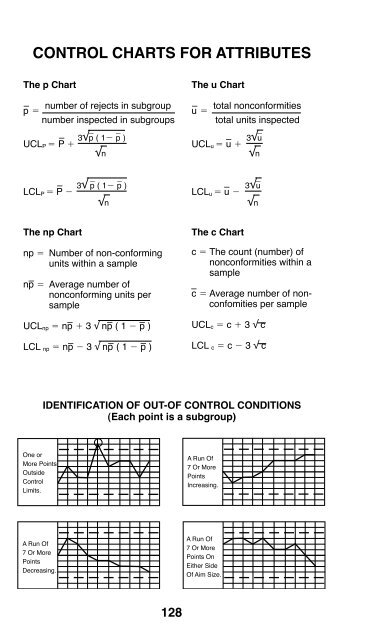
CONTROL CHARTS FOR ATTRIBUTES<br />
The u Chart<br />
u – total noncon<strong>for</strong>mities<br />
5<br />
total units inspected<br />
_<br />
3√u<br />
UCLu 5 u – 1<br />
√n<br />
3√u _<br />
LCLu 5 u – 2<br />
√n<br />
The p Chart<br />
p<br />
The c Chart<br />
c 5 The count (number) of<br />
noncon<strong>for</strong>mities within a<br />
sample<br />
–<br />
c 5 Average number of nonconfomities<br />
per sample<br />
UCLc 5 c 1 3 √ c<br />
LCL c 5 c 2 3 √ c<br />
– number of rejects in subgroup<br />
5<br />
number inspected in subgroups<br />
3√p _ ( 12 p _ )<br />
UCLP 5 P – 1<br />
√n<br />
3√ p _ ( 12 p _ )<br />
LCLP 5 P – 2<br />
√n<br />
The np Chart<br />
np 5 Number of non-con<strong>for</strong>ming<br />
units within a sample<br />
np – 5 Average number of<br />
noncon<strong>for</strong>ming units per<br />
sample<br />
UCLnp 5 np – 1 3 √ np – ( 1 2 p – )<br />
LCL np 5 np – 2 3 √ np – ( 1 2 p – The u Chart<br />
total noncon<strong>for</strong>mities<br />
u =<br />
)<br />
__________________<br />
total units inspected<br />
3√ u<br />
UCLu = u + _____<br />
√n<br />
3√ u<br />
LCLu = u - _____<br />
√n<br />
The p Chart<br />
number of rejects in subgroup<br />
p =<br />
The u Chart<br />
c = The count (number) of<br />
noncon<strong>for</strong>mities within a<br />
sample<br />
c = Average number of nonconfomities<br />
per sample<br />
UCL = c + 3 √ c<br />
c<br />
LCL = c - 3 √ c<br />
c _________________________<br />
number inspected in subgroups<br />
______<br />
3√ p ( 1- p )<br />
UCLP = P + _________<br />
√n<br />
3√ p ( 1- p )<br />
LCLP = P - _________<br />
√n<br />
_<br />
_ _<br />
_<br />
_<br />
_ _<br />
_<br />
_<br />
_<br />
_<br />
_<br />
The np Chart<br />
np = Number of non-con<strong>for</strong>ming<br />
units within a sample<br />
_<br />
np = Average number of<br />
noncon<strong>for</strong>ming units per<br />
sample<br />
_ _ _<br />
UCL = np + 3 √ np (1 - p )<br />
np<br />
_ _ _<br />
LCL = np - 3 √ np (1 - p )<br />
np<br />
_<br />
One or<br />
More Points<br />
Outside<br />
Control<br />
Limits.<br />
A Run Of<br />
7 Or More<br />
Points<br />
Decreasing.<br />
IDENTIFICATION Identification OF of OUT-OF Out-of Control CONTROL Conditions CONDITIONS<br />
(Each point is a subgroup)<br />
128<br />
A Run Of<br />
7 Or More<br />
Points<br />
Increasing.<br />
A Run Of<br />
7 Or More<br />
Points On<br />
Either Side<br />
Of Aim Size.