SPENDING POTENTIAL IN PRIMARY AND SECONDARY MARKET AREAS If one looks just at the number of households and their median income, the retail spending potential in the half mile trade area looks weak, however a closer look at ESRI Community Analyst data reveals that 26% of households in that area earn more than $50,000 per year and that 14% have a Masters Degree or higher level education. By 2015, 33% of the area’s residents are expected to earn $50,000 or more per year. Overall, the 2010 median household income of $19,740 is expected to rise to $25,631 in 2015, a 33% rise. In 2015, 18% of the households within the primary trade area will make between $25,000 and $49,000 per year. All numbers are in inflation adjusted 2009 dollars. Attracting residents from all of these income groups to <strong>39th</strong> street will be important to the corridor’s future success. Fifteen percent of the half mile trade area’s 5107 housing units are owner occupied, 85% are renter occupied. Of the area’s 5107 households, 55% or 2809 are families. This indicates a stability that counters the high number of renters. The median age of 31.9 is projected to rise only slightly to 32.3 in 2015, which means a young population whose incomes will most likely rise in the future and will be able to support more local development. The shopper of 2015 will be a more affluent, more educated version of the 2010 shopper, and a homeowner. With 1 to 3 bedroom condos in 3 to 6-flat buildings, townhomes and single family homes priced between $179,000 - $389,000, Oakwood Shores will bring residents from Key Stats 2010 a mix of incomes together. As homeowners and wage earners they will expect a corridor with amenities that provide for their daily needs and aspirations. .5 Miles: <strong>39th</strong> & KING DR. 1 Mile 3 Mile Chicago Households 5,107 16,464 259,055 1,063,047 Population 13,315 45,557 100,011 2,824,064 Population Density 15,585 ******* ******* 17092 Median Age 31.9 29.1 31.3 32.8 Household Average Income $36,404 $38,563 $54,875 $53,226 Median Household Income $19,740 $21,616 $38,281 $46,781 % African American Population 97.0% 90.9% 52.0% 34.1% % Hispanic Population 1.4% 1.6% 19.3% 27.4% Total Retail Expenditure $39,196,449 $132,490,370 $863,438,169 $73,688,472,212 Apparel and Services $4,909,201 $16,677,424 $145,185,540 $10,683,254,151 Alcoholic Beverages $1,746,470 $5,858,897 $50,385,774 $324,104,319 Restaurants $9,236,654 $31,264,151 $270,615,913 $6,844,158,150 Grocery Stores $13,383,950 $76,366,875 $381,457,722 $19,920,782,603 Table 1 Demographic Data Source: ESRI Community Analyst In inflation adjusted 2009 dollars. Key Stats 2015 .5 Miles: <strong>39th</strong> & KING DR. 1 Mile 3 Mile Households 5,051 16,556 260,271 Population 13,193 45,985 100,808 Population Density 15,023 Median Age 32.3 29.2 31.4 Household Average Income $43,127 $45,861 $66,195 Median Household Income $25,631 $27,274 $48,445 % African American Population 96.4% 90.3% 51.1% % Hispanic Population 1.9% 2.0% 20.5% Table 2 Demographic Data Source: ESRI Community Analyst In adjusted 2009 dollars. 10
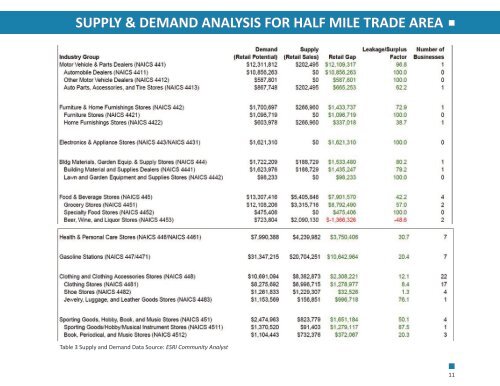
SUPPLY & DEMAND ANALYSIS FOR HALF MILE TRADE AREA Table 3 Supply and Demand Data Source: ESRI Community Analyst 11