semi-annual report 30 Sep 2010 - SEB Asset Management
semi-annual report 30 Sep 2010 - SEB Asset Management
semi-annual report 30 Sep 2010 - SEB Asset Management

Create successful ePaper yourself
Turn your PDF publications into a flip-book with our unique Google optimized e-Paper software.
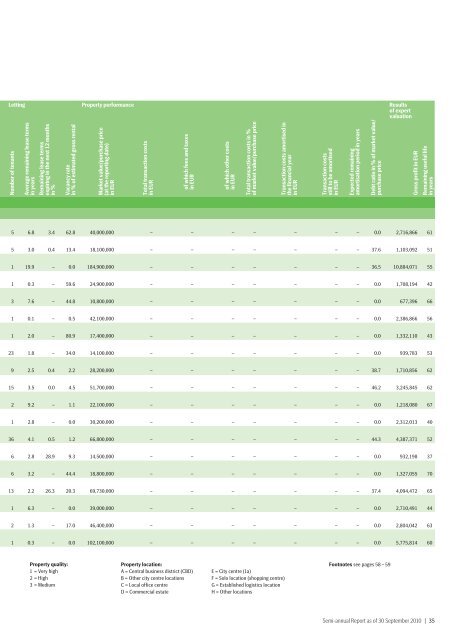
Letting Property performance Results<br />
of expert<br />
valuation<br />
Number of tenants<br />
Average remaining lease terms<br />
in years<br />
Remaining lease terms<br />
expiring in the next 12 months<br />
in %<br />
Vacancy rate<br />
in % of estimated gross rental<br />
Market value/purchase price<br />
(at the <strong>report</strong>ing date)<br />
in EUR<br />
Total transaction costs<br />
in EUR<br />
of which fees and taxes<br />
in EUR<br />
of which other costs<br />
in EUR<br />
Total transaction costs in %<br />
of market value/purchase price<br />
Transaction costs amortised in<br />
the financial year<br />
in EUR<br />
Transaction costs<br />
still to be amortised<br />
in EUR<br />
Expected remaining<br />
amortisation period in years<br />
Debt ratio in % of market value/<br />
purchase price<br />
Gross profit in EUR<br />
Remaining useful life<br />
in years<br />
5 6.8 3.4 62.8 40,000,000 – – – – – – – 0.0 2,716,866 61<br />
5 3.0 0.4 13.4 18,100,000 – – – – – – – 37.6 1,103,092 51<br />
1 19.9 – 0.0 184,900,000 – – – – – – – 36.5 10,884,071 55<br />
1 0.3 – 59.6 24,900,000 – – – – – – – 0.0 1,708,194 42<br />
3 7.6 – 44.8 10,800,000 – – – – – – – 0.0 677,396 66<br />
1 0.1 – 0.5 42,100,000 – – – – – – – 0.0 2,386,866 56<br />
1 2.0 – 80.9 17,400,000 – – – – – – – 0.0 1,332,110 43<br />
23 1.8 – 34.0 14,100,000 – – – – – – – 0.0 939,783 53<br />
9 2.5 0.4 2.2 28,200,000 – – – – – – – 38.7 1,710,856 62<br />
15 3.5 0.0 4.5 51,700,000 – – – – – – – 46.2 3,245,845 62<br />
2 9.2 – 1.1 22,100,000 – – – – – – – 0.0 1,218,080 67<br />
1 2.8 – 0.0 <strong>30</strong>,200,000 – – – – – – – 0.0 2,312,013 40<br />
36 4.1 0.5 1.2 66,800,000 – – – – – – – 44.3 4,387,371 52<br />
6 2.8 28.9 9.3 14,500,000 – – – – – – – 0.0 932,198 37<br />
6 3.2 – 44.4 18,800,000 – – – – – – – 0.0 1,327,055 70<br />
13 2.2 26.3 20.3 69,7<strong>30</strong>,000 – – – – – – – 37.4 4,094,472 65<br />
1 6.3 – 0.0 39,000,000 – – – – – – – 0.0 2,710,491 44<br />
2 1.3 – 17.0 46,400,000 – – – – – – – 0.0 2,804,042 63<br />
1 0.3 – 0.0 102,100,000 – – – – – – – 0.0 5,775,814 60<br />
Property quality:<br />
1 = Very high<br />
2 = High<br />
3 = Medium<br />
Property location:<br />
A = Central business district (CBD)<br />
B = Other city centre locations<br />
C = Local office centre<br />
D = Commercial estate<br />
E = City centre (1a)<br />
F = Solo location (shopping centre)<br />
G = Established logistics location<br />
H = Other locations<br />
Footnotes see pages 58 – 59<br />
Semi-<strong>annual</strong> Report as of <strong>30</strong> <strong>Sep</strong>tember <strong>2010</strong> | 35