semi-annual report 30 Sep 2010 - SEB Asset Management
semi-annual report 30 Sep 2010 - SEB Asset Management
semi-annual report 30 Sep 2010 - SEB Asset Management

Create successful ePaper yourself
Turn your PDF publications into a flip-book with our unique Google optimized e-Paper software.
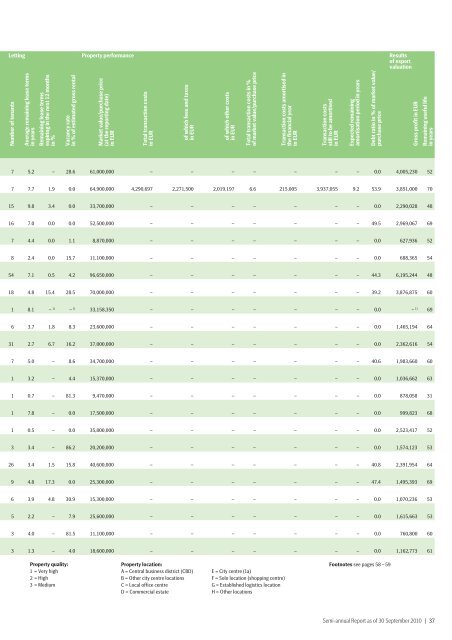
Letting Property performance Results<br />
of expert<br />
valuation<br />
Number of tenants<br />
Average remaining lease terms<br />
in years<br />
Remaining lease terms<br />
expiring in the next 12 months<br />
in %<br />
Vacancy rate<br />
in % of estimated gross rental<br />
Market value/purchase price<br />
(at the <strong>report</strong>ing date)<br />
in EUR<br />
Total transaction costs<br />
in EUR<br />
of which fees and taxes<br />
in EUR<br />
of which other costs<br />
in EUR<br />
Total transaction costs in %<br />
of market value/purchase price<br />
Transaction costs amortised in<br />
the financial year<br />
in EUR<br />
Transaction costs<br />
still to be amortised<br />
in EUR<br />
Expected remaining<br />
amortisation period in years<br />
Debt ratio in % of market value/<br />
purchase price<br />
Gross profit in EUR<br />
Remaining useful life<br />
in years<br />
7 5.2 – 28.6 61,000,000 – – – – – – – 0.0 4,005,2<strong>30</strong> 52<br />
7 7.7 1.9 0.0 64,900,000 4,290,697 2,271,500 2,019,197 6.6 215,005 3,937,055 9.2 53.9 3,851,000 70<br />
15 9.8 3.4 0.0 33,700,000 – – – – – – – 0.0 2,290,028 48<br />
16 7.0 0.0 0.0 52,500,000 – – – – – – – 49.5 2,969,067 69<br />
7 4.4 0.0 1.1 8,870,000 – – – – – – – 0.0 627,936 52<br />
8 2.4 0.0 15.7 11,100,000 – – – – – – – 0.0 688,365 54<br />
54 7.1 0.5 4.2 96,650,000 – – – – – – – 44.3 6,195,244 48<br />
18 4.8 15.4 28.5 70,000,000 – – – – – – – 39.2 3,876,875 60<br />
1 8.1 – 1) – 1) 33,158,350 – – – – – – – 0.0 – 1) 69<br />
6 3.7 1.8 8.3 23,600,000 – – – – – – – 0.0 1,465,194 64<br />
31 2.7 6.7 16.2 37,000,000 – – – – – – – 0.0 2,362,616 54<br />
7 5.0 – 8.6 34,700,000 – – – – – – – 40.6 1,983,660 60<br />
1 3.2 – 4.4 15,370,000 – – – – – – – 0.0 1,036,662 63<br />
1 0.7 – 81.3 9,470,000 – – – – – – – 0.0 878,058 31<br />
1 7.8 – 0.0 17,500,000 – – – – – – – 0.0 999,823 68<br />
1 0.5 – 0.0 35,800,000 – – – – – – – 0.0 2,523,417 52<br />
3 3.4 – 86.2 20,200,000 – – – – – – – 0.0 1,574,123 53<br />
26 3.4 1.5 15.8 40,600,000 – – – – – – – 40.8 2,391,954 64<br />
9 4.8 17.3 0.0 25,<strong>30</strong>0,000 – – – – – – – 47.4 1,495,393 69<br />
6 3.9 4.8 <strong>30</strong>.9 15,<strong>30</strong>0,000 – – – – – – – 0.0 1,070,236 53<br />
5 2.2 – 7.9 25,600,000 – – – – – – – 0.0 1,615,663 53<br />
3 4.0 – 81.5 11,100,000 – – – – – – – 0.0 760,800 60<br />
3 1.3 – 4.0 18,600,000 – – – – – – – 0.0 1,162,773 61<br />
Property quality:<br />
1 = Very high<br />
2 = High<br />
3 = Medium<br />
Property location:<br />
A = Central business district (CBD)<br />
B = Other city centre locations<br />
C = Local office centre<br />
D = Commercial estate<br />
E = City centre (1a)<br />
F = Solo location (shopping centre)<br />
G = Established logistics location<br />
H = Other locations<br />
Footnotes see pages 58 – 59<br />
Semi-<strong>annual</strong> Report as of <strong>30</strong> <strong>Sep</strong>tember <strong>2010</strong> | 37