semi-annual report 30 Sep 2010 - SEB Asset Management
semi-annual report 30 Sep 2010 - SEB Asset Management
semi-annual report 30 Sep 2010 - SEB Asset Management

You also want an ePaper? Increase the reach of your titles
YUMPU automatically turns print PDFs into web optimized ePapers that Google loves.
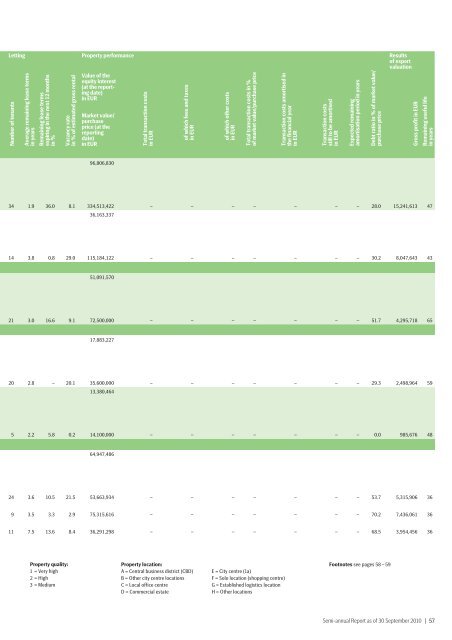
Letting Property performance Results<br />
of expert<br />
valuation<br />
Number of tenants<br />
Average remaining lease terms<br />
in years<br />
Remaining lease terms<br />
expiring in the next 12 months<br />
in %<br />
Vacancy rate<br />
in % of estimated gross rental<br />
Value of the<br />
equity interest<br />
(at the <strong>report</strong>ing<br />
date)<br />
in EUR<br />
Market value/<br />
purchase<br />
price (at the<br />
<strong>report</strong>ing<br />
date)<br />
in EUR<br />
96,806,8<strong>30</strong><br />
Total transaction costs<br />
in EUR<br />
of which fees and taxes<br />
in EUR<br />
of which other costs<br />
in EUR<br />
Total transaction costs in %<br />
of market value/purchase price<br />
Transaction costs amortised in<br />
the financial year<br />
in EUR<br />
Transaction costs<br />
still to be amortised<br />
in EUR<br />
Expected remaining<br />
amortisation period in years<br />
Debt ratio in % of market value/<br />
purchase price<br />
Gross profit in EUR<br />
Remaining useful life<br />
in years<br />
34 1.9 36.0 8.1 334,513,422<br />
36,163,337<br />
– – – – – – – 28.0 15,241,613 47<br />
14 3.8 0.8 29.0 115,184,122 – – – – – – – <strong>30</strong>.2 8,047,643 43<br />
51,091,570<br />
21 3.0 16.6 9.1 72,500,000 – – – – – – – 51.7 4,295,718 65<br />
17,883,227<br />
20 2.8 – 20.1 35,600,000<br />
13,380,464<br />
– – – – – – – 29.3 2,498,964 59<br />
5 2.2 5.8 0.2 14,100,000 – – – – – – – 0.0 985,676 48<br />
64,947,486<br />
24 3.6 10.5 21.5 53,663,934 – – – – – – – 53.7 5,315,906 36<br />
9 3.5 3.3 2.9 75,315,616 – – – – – – – 70.2 7,436,061 36<br />
11 7.5 13.6 8.4 36,291,298 – – – – – – – 68.5 3,954,456 36<br />
Property quality:<br />
1 = Very high<br />
2 = High<br />
3 = Medium<br />
Property location:<br />
A = Central business district (CBD)<br />
B = Other city centre locations<br />
C = Local office centre<br />
D = Commercial estate<br />
E = City centre (1a)<br />
F = Solo location (shopping centre)<br />
G = Established logistics location<br />
H = Other locations<br />
Footnotes see pages 58 – 59<br />
Semi-<strong>annual</strong> Report as of <strong>30</strong> <strong>Sep</strong>tember <strong>2010</strong> | 57